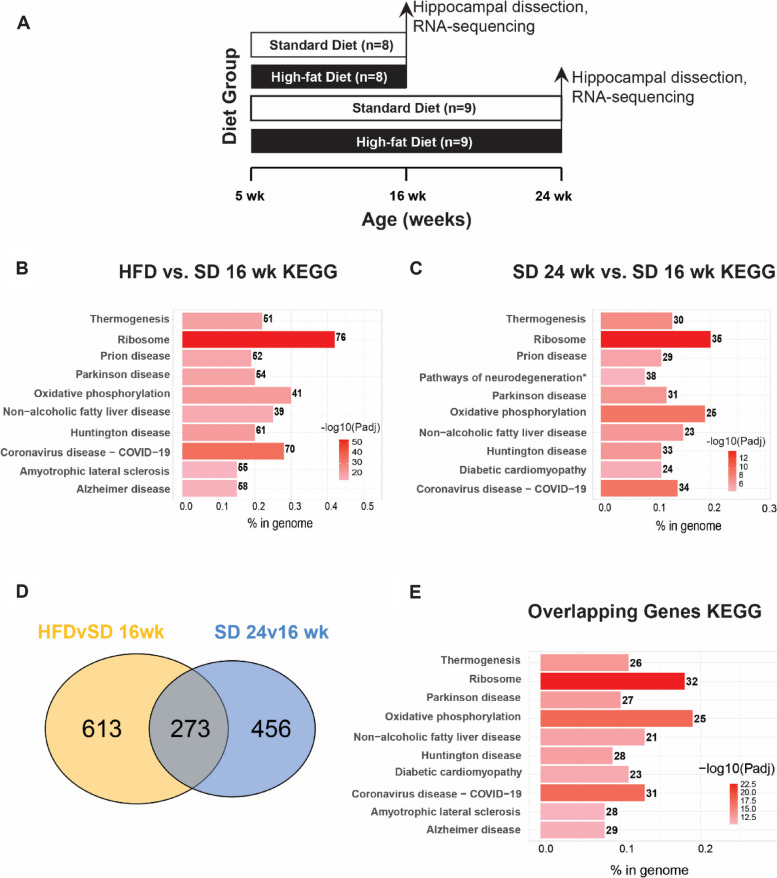
Fig. 1.
Obesity promotes a premature aging transcriptomic signature in the hippocampus. (A) Study paradigm for cohort 1: mice aged 5 wk were fed high-fat diet (HFD) or standard diet (SD) for 11 wk (final age 16 wk) or 19 wk (final age 24 wk) and hippocampi were analyzed by RNA-sequencing. (B) Bar plot of KEGG enrichment analysis of differentially expressed genes (DEGs) in HFD 16 wk versus SD 16 wk. (C) Bar plot of KEGG enrichment analysis of DEGs in SD 24 wk versus SD 16 wk DEGs. (D) Venn diagram of overlapping DEGs (adjusted P-value < 0.05; grey) in HFD 16 wk versus SD 16 wk comparison (yellow) with SD 24 wk versus SD 16 wk comparison (light blue). (E) Bar plot of KEGG enrichment analysis of the 273 overlapping DEGs from (D). For (B), (C), and (E), bar color represents -log10(Padj), number to the right of the bar represents number of DEGs in the KEGG pathway, and bar length along the x-axis, ‘% in genome,’ represents the fraction of DEGs relative to all KEGG pathway genes

