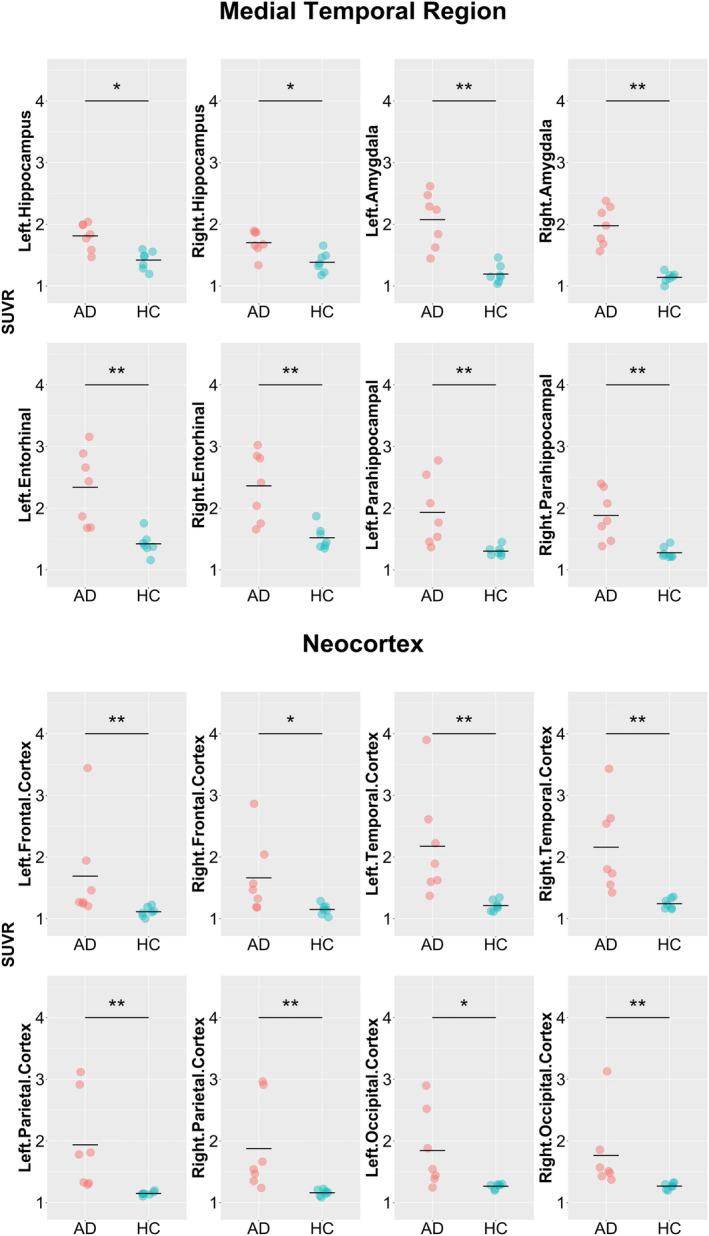
FIGURE 1.

Comparison of 18F‐PI‐2620 SUVR between the AD and HC groups. AD, Alzheimer’s disease; HC, healthy control; SUVR, standardized uptake value ratio. Comparison of SUVR in the target regions of interest. The dots in the graph indicate the SUVR value in each participant and the horizontal bar indicates the mean SUVR value. AD and HC participants are expressed in red and green dots, respectively. Asterisks (*) and (**) represent significant P‐values after false discovery rate (FDR) correction at q = 0.05 and 0.01, respectively
