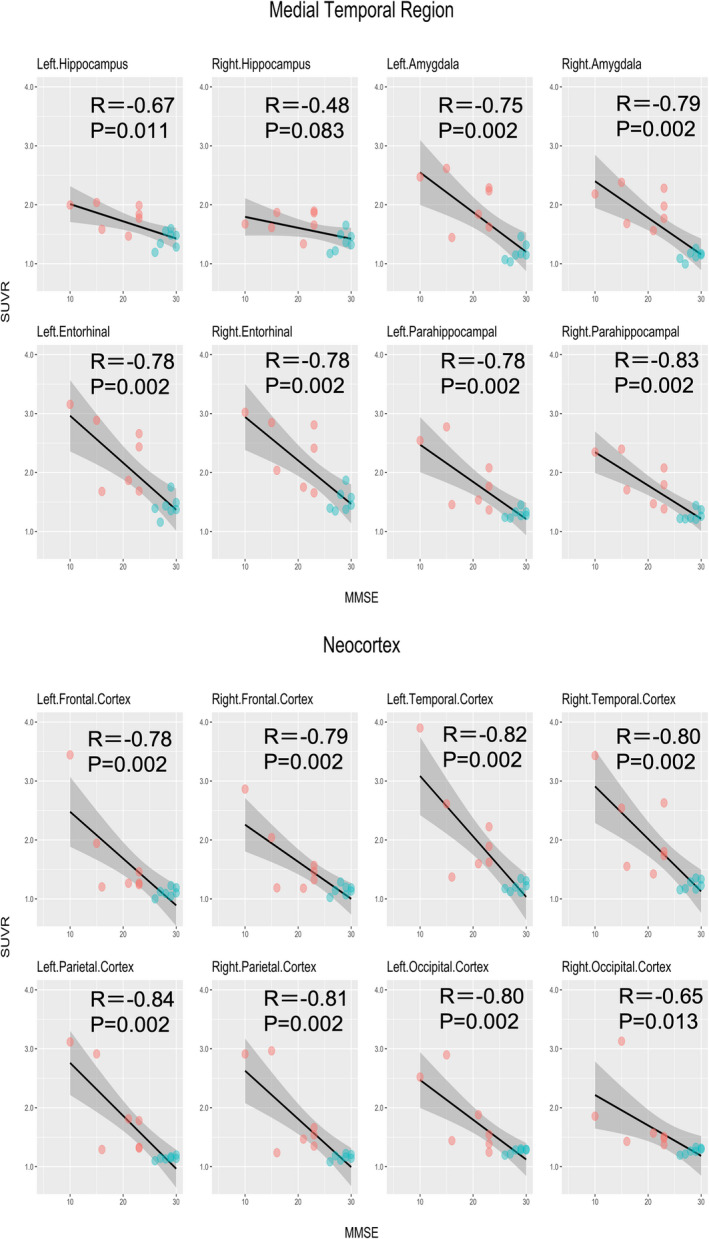
FIGURE 3.

Correlations between 18F‐PI‐2620 SUVR and MMSE. MMSE, Mini‐Mental State Examination; P, P‐values after false discovery rate (FDR) correction; R, Pearson’s correlation coefficient; SUVR, standardized uptake value ratio. Correlations between SUVR in the target regions of interest and the MMSE scores. AD and HC participants are expressed in red and green dots, respectively
