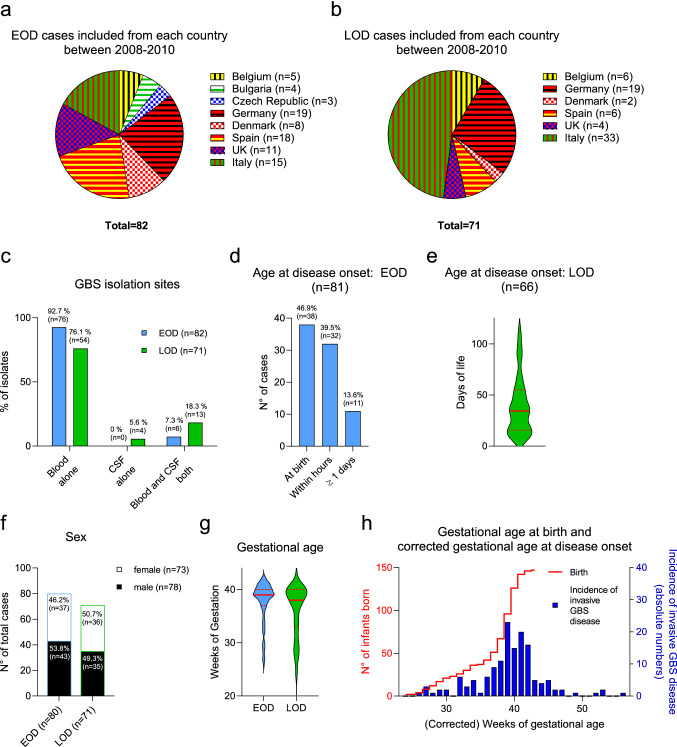
Fig. 1.
Case distribution across the eight European countries participating at the DEVANI study and characterization of the study cohort. a, b Number of included invasive GBS cases from each participating country. (a EOD cases. b LOD cases). c Isolation sites of invasive GBS strains in EOD and LOD cases. d, e Age at onset of disease of EOD, LOD and VLOD cases. The red lines in e. indicate the median with interquartile ranges. f Sex of EOD and LOD cases. g Gestational age at birth of EOD and LOD cases. The red lines indicate the median with interquartile ranges. h The reverse Kaplan–Meier curve in red indicates the gestational age at birth, the blue bar graphs represent the incidence during the respective corrected gestational age. Data from EOD and LOD are pooled in this graph. GBS Group B streptococcus, CSF Cerebrospinal fluid, EOD Early-onset disease, LOD Late-onset disease

