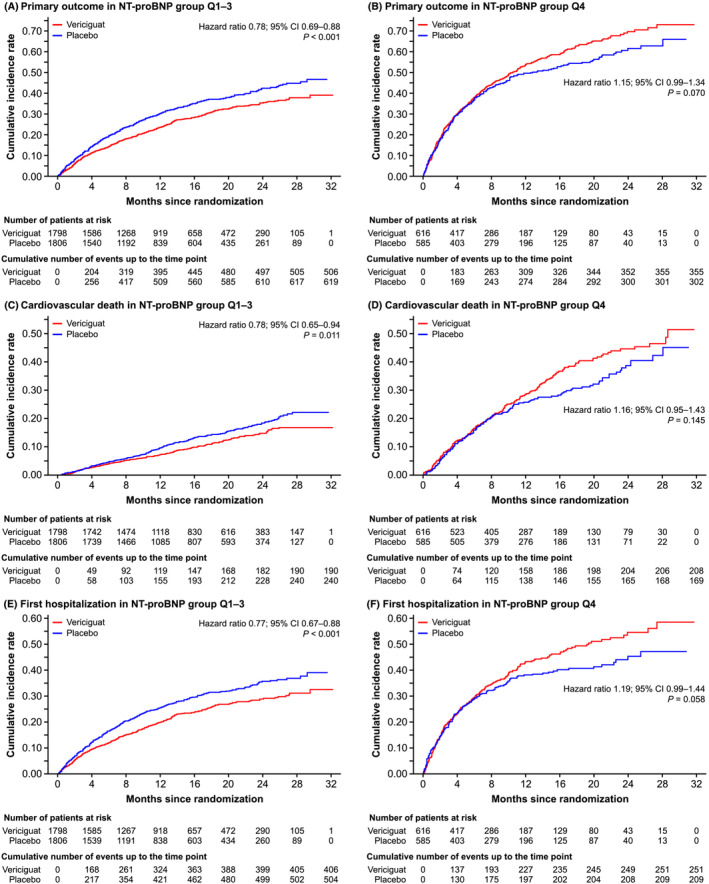
Figure 1.

Kaplan–Meier curves of clinical outcomes for the primary composite endpoint and its components in patients with baseline NT‐proBNP levels in Quartiles 1–3 (Q1–Q3) and Quartile 4 (Q4). Primary outcome was composite of death from cardiovascular causes or first hospitalization for HF. Cumulative incidences of composite endpoint by NT‐proBNP group (Q1–Q3 and Q4) are shown in Panels A and B, respectively. Cumulative incidences of cardiovascular death by NT‐proBNP group (Q1–Q3 and Q4) are shown in Panels C and D, respectively. Cumulative incidences of first hospitalization by NT‐proBNP group (Q1–Q3 and Q4) are shown in Panels E and F, respectively. CI, confidence interval; CV, cardiovascular; HF, heart failure; NT‐proBNP, N‐terminal pro‐brain natriuretic peptide.
