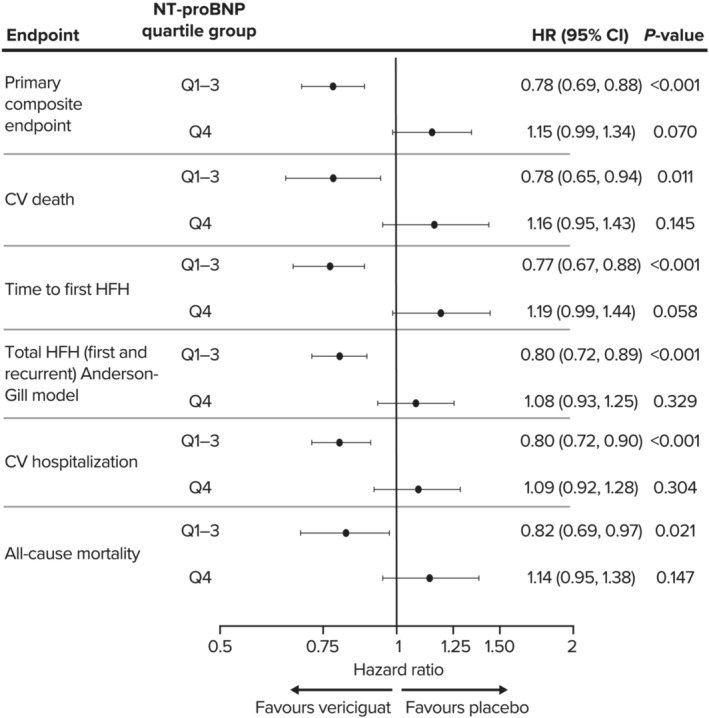
Figure 2.

Forest plot of hazard ratios with 95% confidence intervals are shown for the primary composite endpoint and its components, CV death and time to first HF hospitalization, as well as total HF hospitalization, CV hospitalization, and all‐cause mortality, in patients with baseline NT‐proBNP levels in Quartiles 1–3 (Q1–Q3) and Quartile 4 (Q4). CI, confidence interval; CV, cardiovascular; HF, heart failure; HFH, heart failure hospitalization; HR, hazard ratio; NT‐proBNP, N‐terminal pro‐brain natriuretic peptide. *Calculated using the Anderson–Gill model.
