
Figure 2.
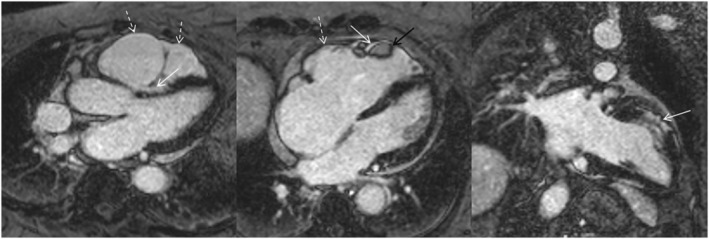
Long axis delayed contrast enhancement cardiac MRI images. Right ventricular dilation and bulging are present, dashed white arrows show the right ventricular wall thinning and akinetic/dyskinetic regions. White arrows show the left and right ventricular delayed contrast enhancement, the black arrow shows the right ventricular thrombus. For further explanation, see text.