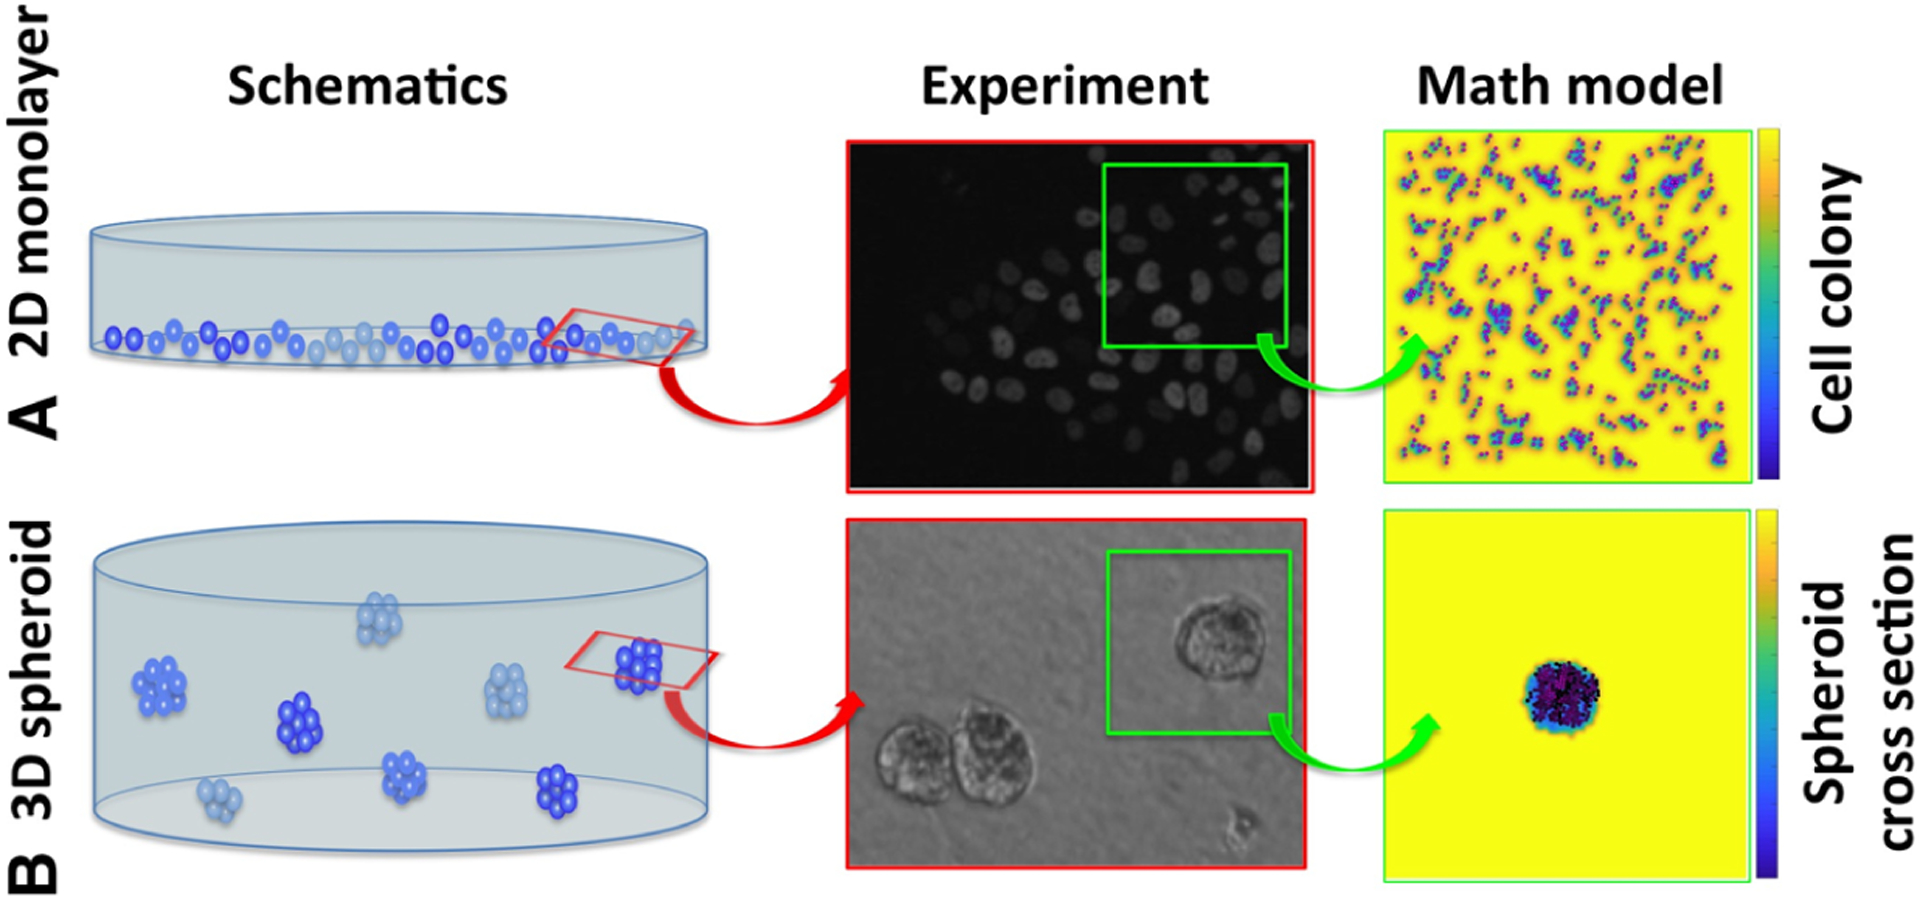
Fig. 1.

Schematics of 2D and 3D cell cultures and their mathematical analogues. a A schematics of the 2D monolayer cell culture, a corresponding fluorescent microscopy image of a part of the Petri dish, and a snapshot from our in silico analogue model of the 2D cell culture. b A schematics of the 3D multicellular spheroid culture, a corresponding bright field microscopy image of a part of the well plate, and a snapshot from our in silico analogue model of the cross section through the 3D spheroid. The background color represents drug concentration to illustrate local drug gradients from high concentration (yellow) to low concentration (blue). Experimental images courtesy of the Moffitt Analytic Microscopy Core
