Fig. 3.

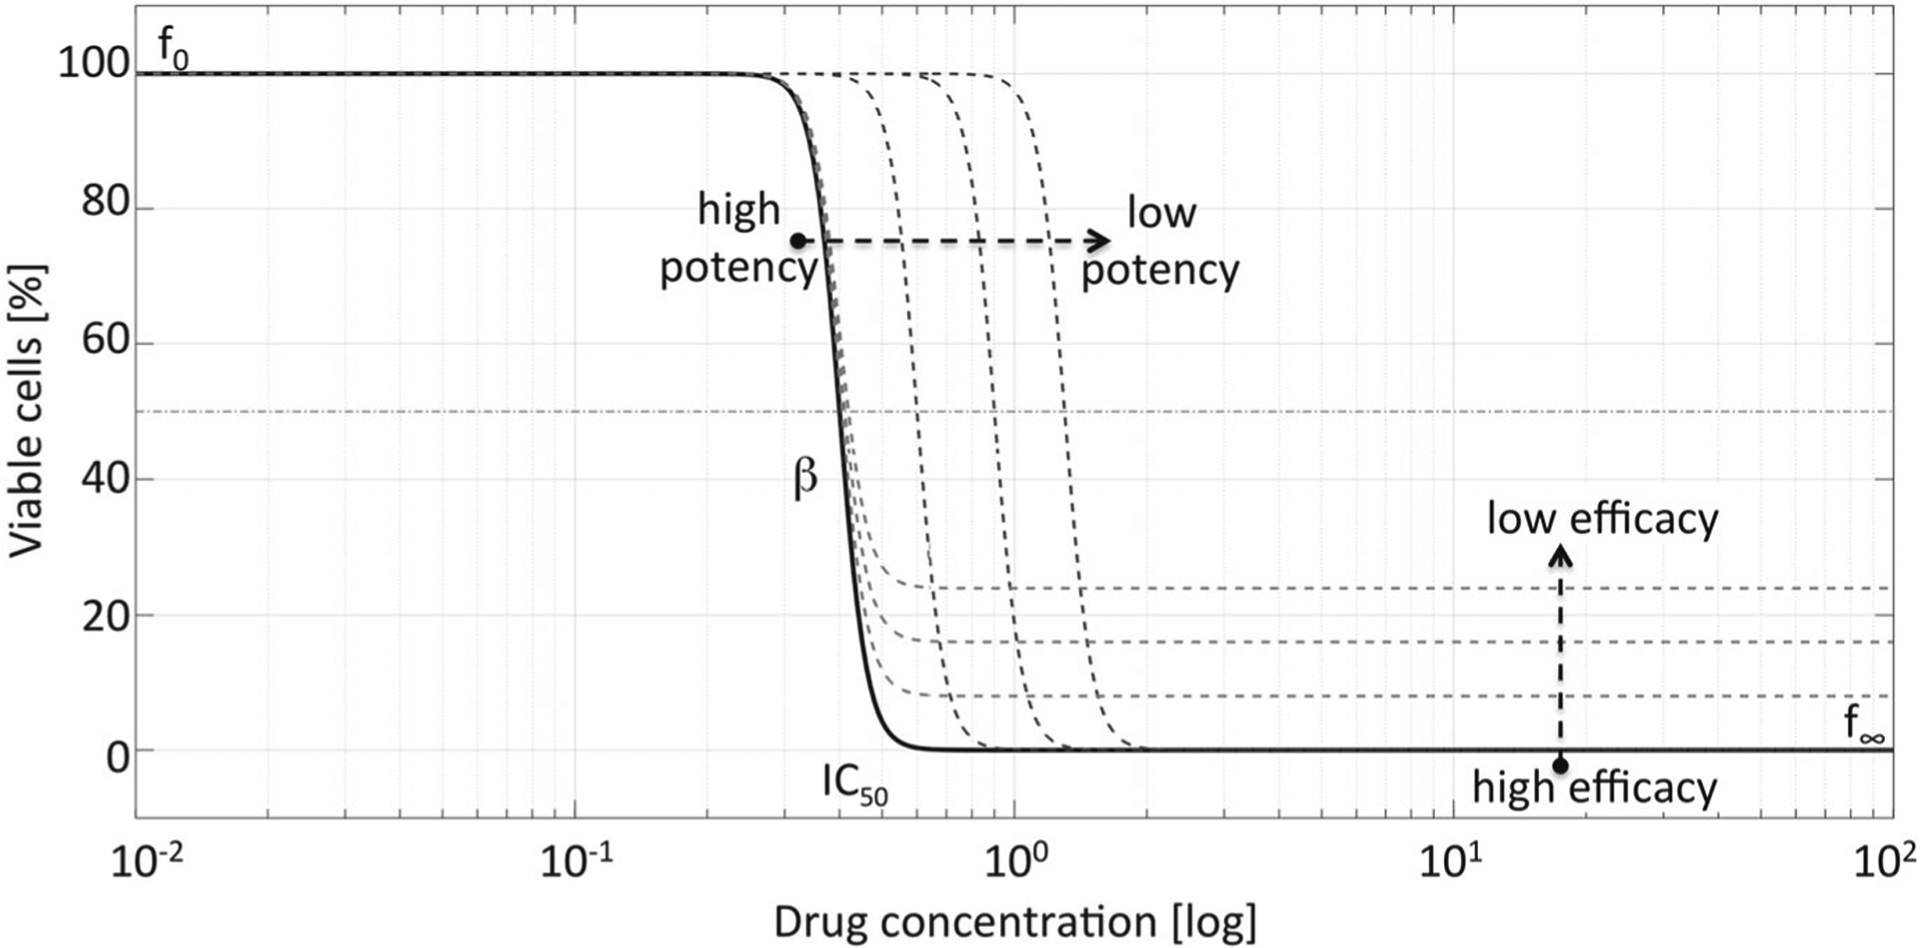
Drug potency and efficacy reflected in IC50 curves. The shape of the IC50 curve depends on the control effect (f0), variability of cell population response (slope β), drug potency (IC50 value), and drug efficacy (background effect f∞)

Drug potency and efficacy reflected in IC50 curves. The shape of the IC50 curve depends on the control effect (f0), variability of cell population response (slope β), drug potency (IC50 value), and drug efficacy (background effect f∞)