
Fig. 4.
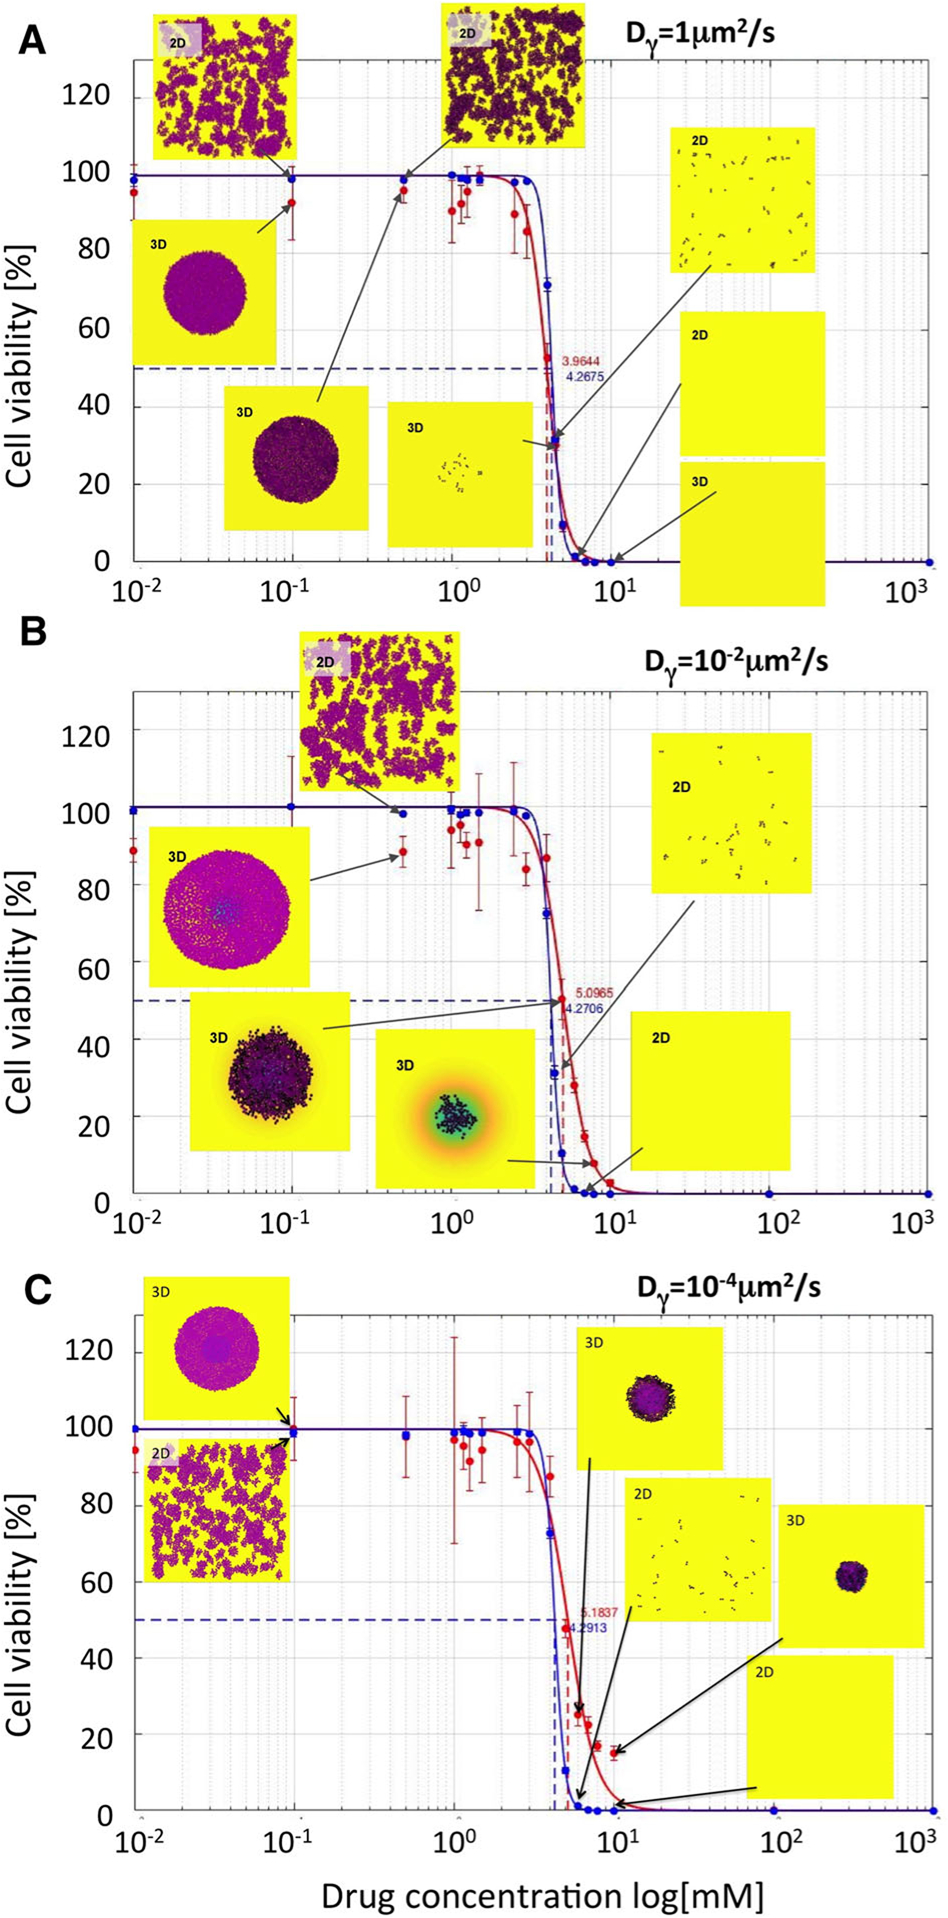
Comparison of IC50 curves and values for cytotoxic drugs. IC50 curves for monolayer cultures (blue curves) and cross sections though spheroid cultures (red curves) and their corresponding IC50 values are shown for the following diffusivity values: a Dγ = 1μm2/s; IC50=4.2675 for 2D and 3.9644 for 3D cultures; b Dγ = 10−2μm2/s; IC50=4.2706 for 2D and 5.0965 for 3D cultures; c Dγ = 10−4μm2/s; IC50=4.2913 for 2D and 5.1837 for 3D cultures. The vertical lines show standard deviation values. Insets show final cell configurations for the selected drug concentrations. Cell colors indicate the level of absorbed drug (low-pink, high-black). Background colors indicate the level of the remaining drug (high-yellow, medium-green, low-blue). The drug was supplied uniformly only once, at the beginning of each simulation. The cell maturation time for these simulations was 18 h