
Fig. 7.
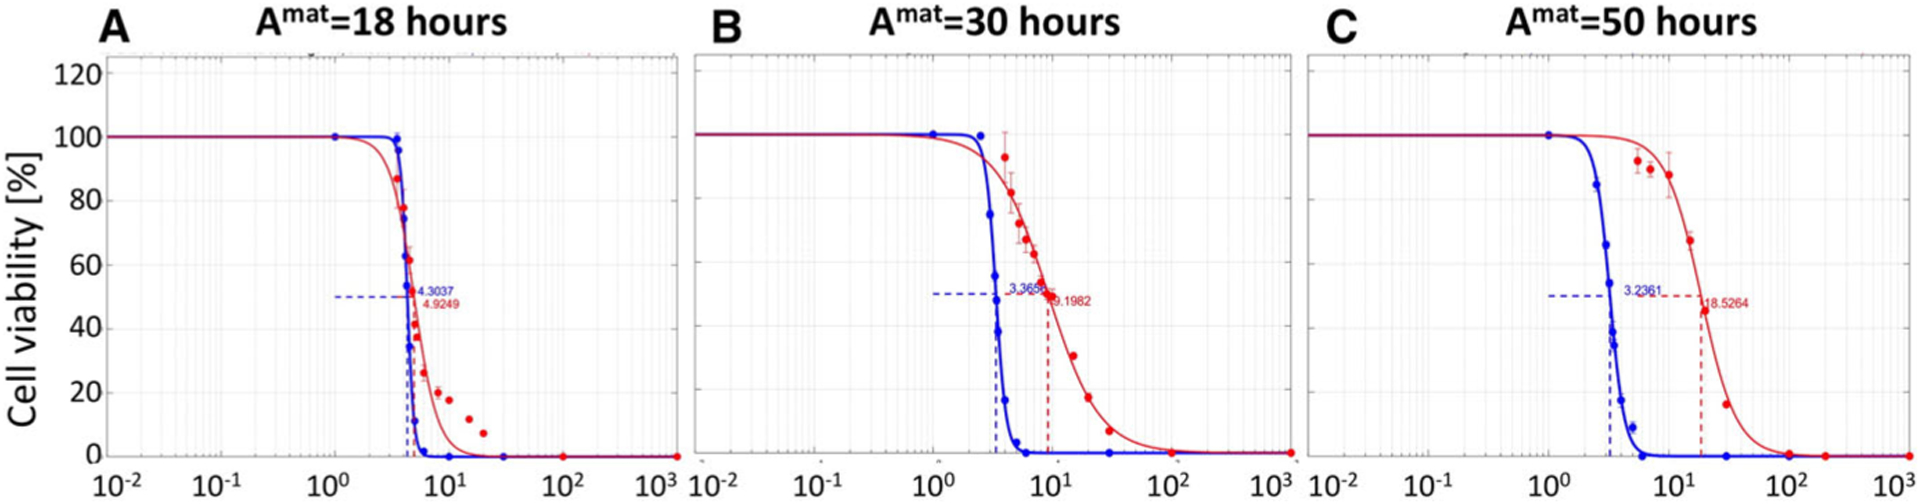
Comparison of IC50 curves for three cell lines of different maturation ages. IC50 curves for drug diffusion coefficient of Dγ = 10−4μm2/s and cell maturation ages of a Amat=18 h, b Amat=30 h, and c Amat=50 h, in 2D cell monolayer culture (blue) and 3D cell spheroid culture (red). All data are presented after 72 h of the simulated time