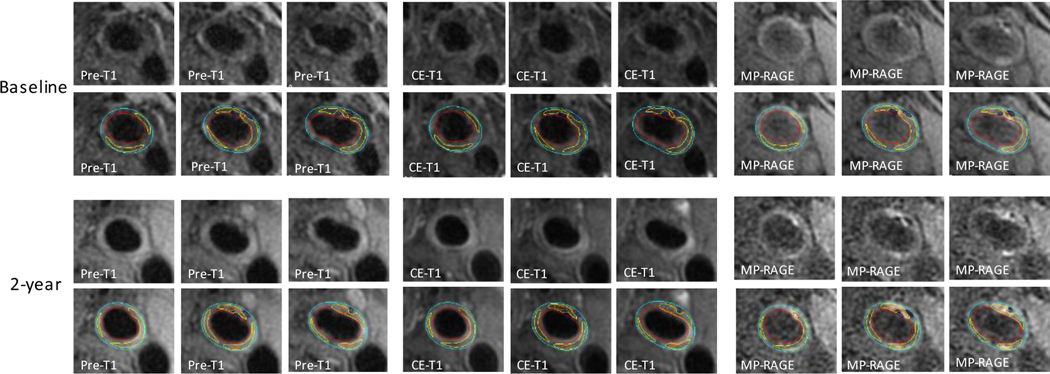
Figure 2: Intraplaque hemorrhage and increase in plaque lipid content despite intensive lipid-lowering therapy.
Upper (baseline) and lower (2-year follow-up) rows of panels show consecutive cross-sectional images of a carotid plaque with intraplaque hemorrhage. Contours have been added in the lower row of each time point (red: lumen boundary; azure: outer wall boundary). Non-/less-enhanced areas on CE-T1 as compared to adjacent fibrous tissue indicate lipid cores (yellow contours). Hyperintense areas on MP-RAGE indicate intraplaque hemorrhage (orange contours). Hypointense areas across the three contrast-weightings indicate calcification (navy blue contours). Changes in MR signals between baseline and 2-year follow-up scans suggest an increase in lipid content with an expansion in intraplaque hemorrhage. Pre-T1 = T1-weighted; CE-T1 = contrast-enhanced T1-weighted; MP-RAGE = magnetization-prepared rapid acquisition gradient echo.

