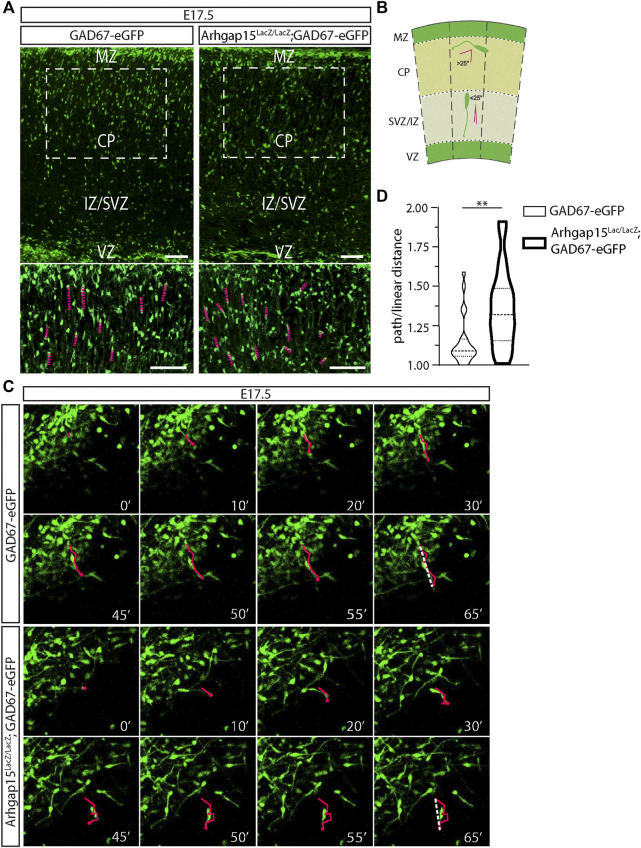
FIGURE 5.
CIN radial migration in the embryonic cortex. (A) Maximum intensity projections of z-stack images (5 serial image planes; z step size = 1 μm) of E17.5 GAD67-eGFP and Arhgap15 LacZ/LacZ ;GAD67-eGFP mouse cortices. Scale bars: 100 µm. The bottom panels show a higher magnification of the region in the dashed box. Scale bars: 100 µm. (B) Schematic representation of the criteria used to discriminate between tangential and radial migrating CINs. The dashed lines indicate perpendicular lines to both the pia and ventricle. Leading processes forming an angle higher than 25° with the dashed line are classified as tangentially migrating CINs, while the ones forming an angle lower than (or equal to) 25° are classified as radially migrating CINs. (C) Frames of representative time-lapse videos (Suppl. Videos 1 and 2) of E17.5 GAD67-eGFP and Arhgap15 LacZ/LacZ ;GAD67-eGFP mouse cortices at different time points (from 0 to 65 min). In each frame, the tip of the leading edge of representative neurons was marked to reconstruct the migratory path. In the last frame (65′), the dashed line shows the linear distance covered by the leading edge. (D) Average ratio between the path and the linear distance covered by GAD67-eGFP and Arhgap15 LacZ/LacZ ;GAD67-eGFP radially migrating neurons in the time window of the time-lapse video. At least 50 neurons from 3 different mice were analyzed for each genotype. p = 0.007. Data are presented as mean ± SEM. p-value was calculated using unpaired Mann–Whitney test. ** = p< 0.01. MZ, marginal zone; CP, cortical plate; IZ, intermediate zone; SVZ, subventricular zone, VZ, ventricular zone.

