
Figure 2.
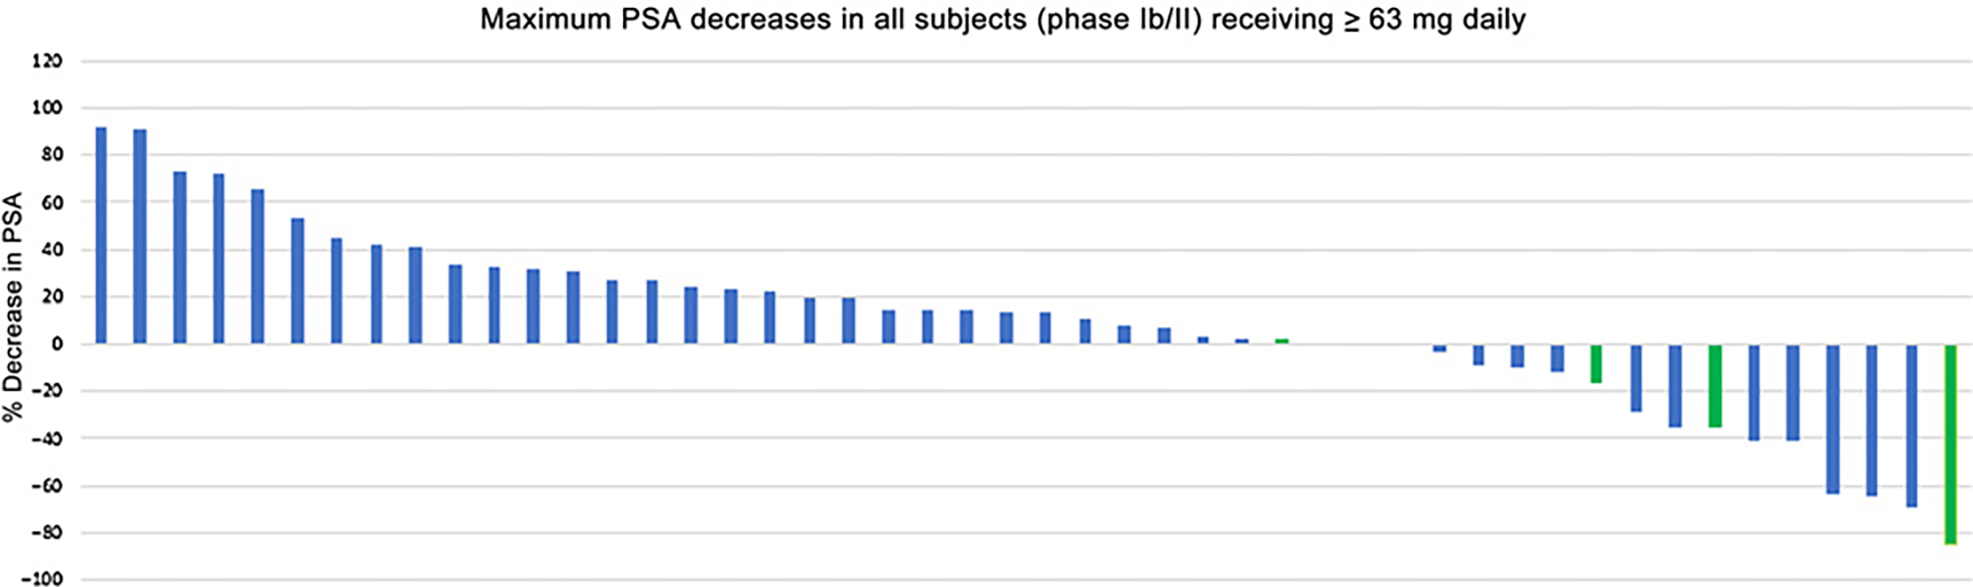
PSA waterfall plot (phase Ib and II clinical studies) of patients treated with ≥ 63 mg daily. Bars labeled in green indicate patients (n = 4) that received 72 mg as their highest dose during the study.
Official websites use .gov
A
.gov website belongs to an official
government organization in the United States.
Secure .gov websites use HTTPS
A lock (
) or https:// means you've safely
connected to the .gov website. Share sensitive
information only on official, secure websites.
PSA waterfall plot (phase Ib and II clinical studies) of patients treated with ≥ 63 mg daily. Bars labeled in green indicate patients (n = 4) that received 72 mg as their highest dose during the study.