Figure 6.
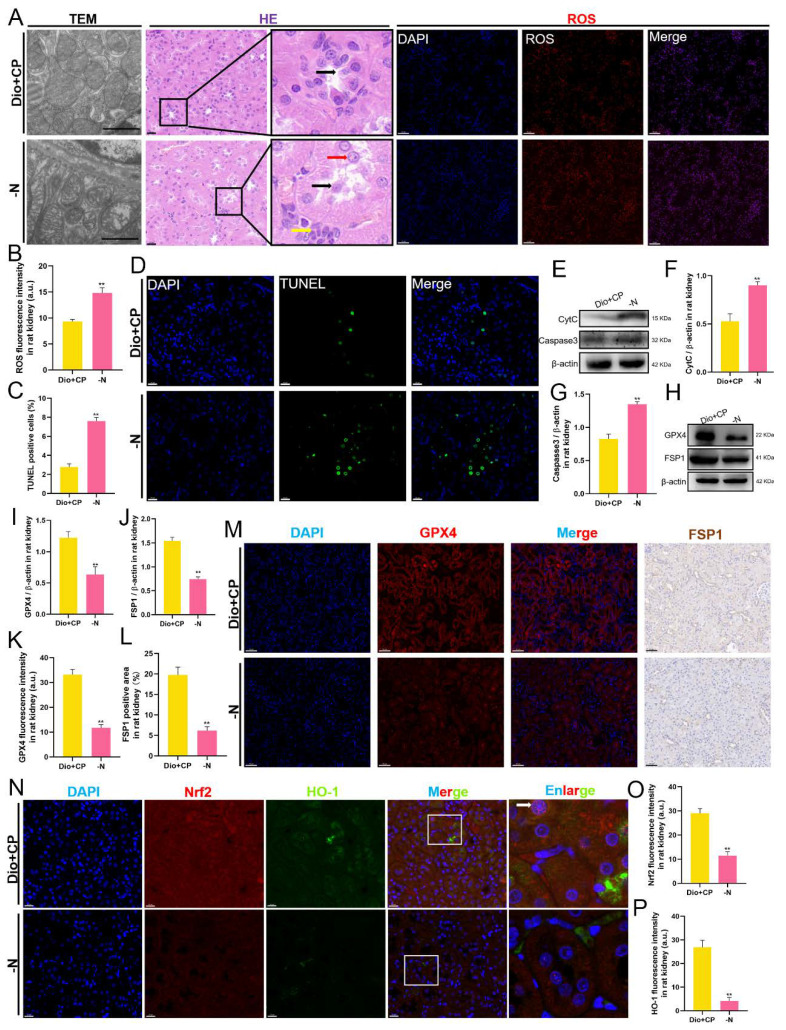
The protective effect of dioscin on rat kidneys is attenuated after Nrf2 inhibition. (A) Representative images of transmission electron microscope (scale bar = 1 μm), H&E staining (scale bar = 20 μm), and ROS staining (scale bar = 50 μm) in rat kidneys (n = 5). (B) Quantification of ROS staining in rat kidneys. (C,D) Representative images and quantification of TUNEL staining (scale bar = 20 μm) in rat kidneys (n = 5). (E–G) The protein levels of CytC and Caspase3 in rat kidneys (n = 3). (H–J) The protein levels of GPX4 and FSP1 in rat kidneys (n = 3). (K–M) Representative images and quantification of GPX4 immunofluorescence (scale bar = 50 μm) and FSP1 immunohistochemistry (scale bar = 50 μm) in rat kidneys (n = 5). (N–P) Representative images and quantification of Nrf2 and HO-1 immunofluorescence (scale bar = 20 μm) in rat kidneys (n = 5). C, control group; Dio, dioscin group; CP, cisplatin group; Dio + CP, dioscin + cisplatin group. ** p < 0.01 represents extremely significant difference. Results are presented as Mean ± SD. Statistical significance was obtained via an unpaired Student’s t-test.

