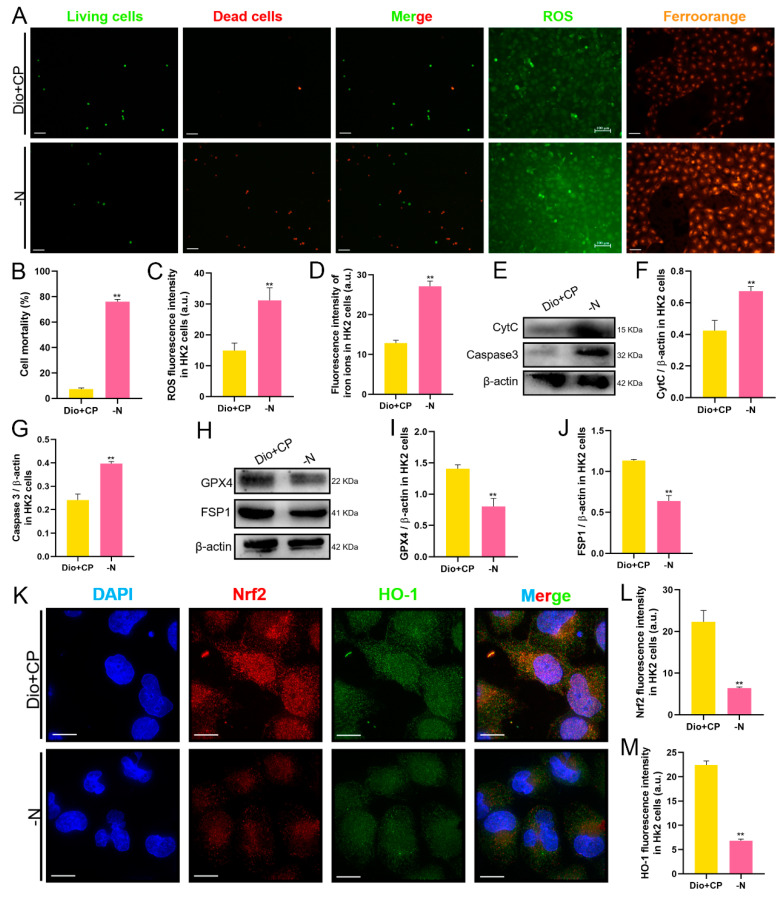
Figure 7.
The protective effect of dioscin on HK2 cells is attenuated after Nrf2 inhibition. (A–D) Representative images and quantification of AO/EB staining (scale bar = 100 μm), ROS staining (scale bar = 100 μm) and ferro orange staining (scale bar = 50 μm) in HK2 cells (n = 5). (E–G) The protein expressions of CytC and Caspase3 in HK2 cells (n = 3). (H–J) The protein expressions of GPX4 and FSP1 in HK2 cells (n = 3). (K–M) Representative images and quantification of Nrf2 and HO-1 immunofluorescence (scale bar = 15 μm) in HK2 cells (n = 5). C, control group; Dio, dioscin group; CP, cisplatin group; Dio + CP, dioscin + cisplatin group. ** p < 0.01 represents extremely significant difference. Results are presented as Mean ± SD. Statistical significance was obtained by an unpaired Student’s t-test.

