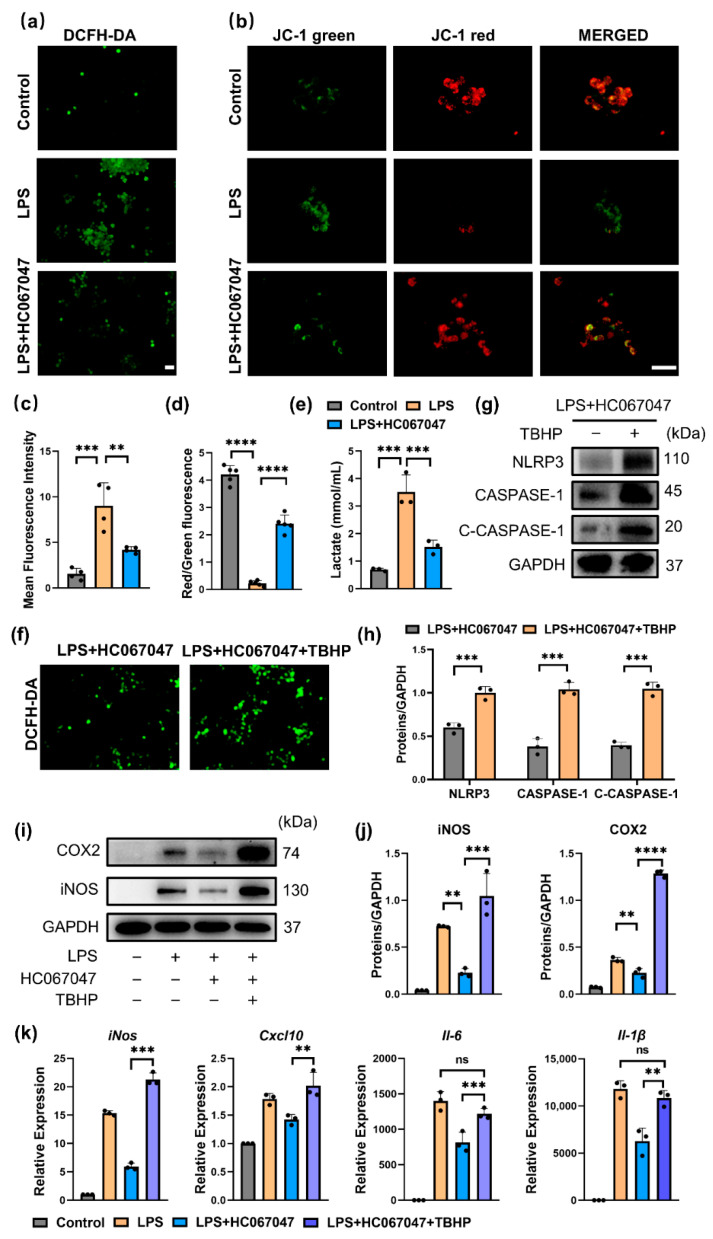
Figure 6.
TRPV4 blockade inhibited NLRP3 via mitochondrial ROS. (a) DCFH-DA fluorescence of mitochondrial ROS in 100 ng/mL LPS-treated cells with 10 μmol/L HC067047 for 6 h (Scale bar: 50 μm) (b) JC-1 green and JC-1 red fluorescence and their colocalization in RAW264.7 cells (Scale bar: 50 μm). (c) Quantitative analysis of the MFI (mean fluorescence intensity) of DCFH-DA. n = 4. One-way ANOVA with Tukey’s post-hoc test, ** p < 0.01; *** p < 0.001. (d) Quantitative analysis of the ratio of JC-1 red to JC-1 green staining. n = 5. One-way ANOVA with Tukey’s post-hoc test, **** p < 0.001. (e) Lactate concentration in RAW 264.7 cells supernatant after stimulated with LPS with or without HC067047 for 6 h. n = 3. One-way ANOVA with Tukey’s post-hoc test *** p < 0.001. (f) DCFH-DA fluorescence in RAW264.7 cells stimulated with LPS + HC067047 with or without 20 μmol/L TBHP for 6 h. (g) Western blot analysis of NLRP3, CASPASE-1, and cleaved CASPASE-1 (C-CASPASE-1) in RAW264.7 cells after treatment with LPS + HC067047 with or without 20 μmol/L TBHP for 24 h. (h) Quantitative analysis of the protein level in (g). n = 3. One-way ANOVA with Tukey’s post-hoc test, *** p < 0.001. (i) COX2 and iNOS protein levels in the cells after treatment with LPS, LPS + HC067047, and LPS + HC067047 + 20 μmol/L TBHP for 24 h. (j) Quantitation of (i). n = 3. One-way ANOVA with Tukey’s post-hoc test, ** p < 0.01; *** p < 0.001; **** p < 0.0001. (k) iNos, Il-6, Cxcl-10, and Il-1β mRNA levels in cells after treatment with LPS, LPS + HC067047, LPS + HC067047 + 20 μmol/L TBHP for 6 h. n = 3. One-way ANOVA with Tukey’s post-hoc test, ** p < 0.01; *** p < 0.001; ns = no significance. All data are shown as mean ± SD.

