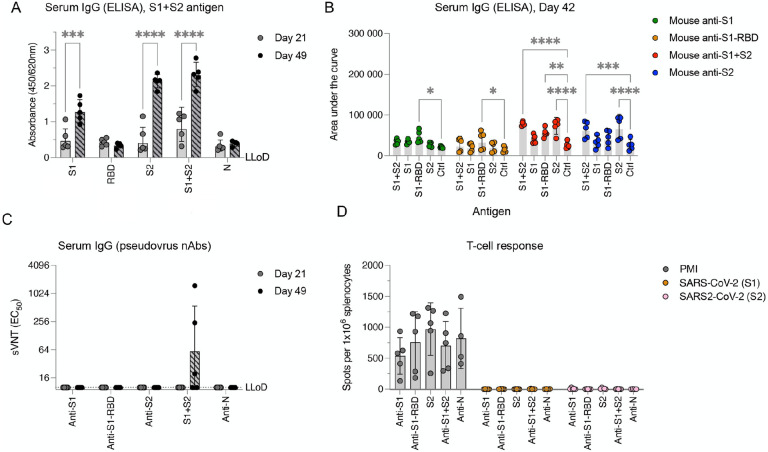
Figure 1. Full-length SARS-CoV-2 spike ectodomain protein elicits poor pseudovirus-neutralizing antibody production and does not elicit T-cell responses.
(A) SARS-CoV-2-spike binding responses. IFNAR−/−-CD46Ge mice were vaccinated intraperitoneally at days 0 and 21 with 5 μg of purified SARS-CoV-2 protein and alum adjuvant: full-length spike ectodomain (S1+S2), spike receptor-binding domain (S1-RBD), Spike S1 domain (S1), spike S2 domain (S2), and nucleocapsid (N). Serum samples were collected on days 21 (before the second vaccination) and 41 for quantification of the levels of Spike ectodomain binding IgG antibodies by enzyme-linked immunosorbent assay (ELISA). (B) Binding IgG in serum from mice vaccinated twice with SARS-CoV-2 spike protein or domains (S1, green; S1-RBD, orange; S1+S1, red; S2, blue) was also quantified by ELISA for binding to homologous or heterologous antigens. Serial fivefold dilutions were assessed, and data were computed as the area under the curve. (C) Pseudovirus-neutralizing antibody responses. Neutralizing-antibody titers in mice vaccinated once (day 21) or twice (day 42) with the indicated SARS-CoV-2 proteins were determined using pseudotyped viruses expressing the SARS-CoV-2 spike protein bearing the D614G amino acid change. Virus neutralization was plotted as the percentage of relative virus infection over the inverse of serum dilution. The inverse of the serum dilution resulting in 50% inhibition of infection (EC50) was determined and plotted. Antibody titers below the lower limit of detection (LLoD) were treated as 0.5xLLoD. (D) T-cell responses elicited against SARS-CoV-2 spike. An ELISPOT assay for IFN-γ was performed on splenocytes isolated from mice vaccinated twice (day 42) and stimulated ex vivo with PMA/ionomycin (PMI) or two separate pools of 15-mer, 11-aa-overlapping peptides comprising the SARS-CoV-2 spike (S1, aa 1–632; S2, aa 632–1273). The data are shown as IFN-γ-secreting cells or spot-forming cells (SFCs) per 1×10⁶ splenocytes. Values represent the geometric mean ± geometric standard deviation, with each data point representing an individual mouse. Statistical significance was determined using two-way ANOVA with Dunnett’s multiple comparison test (*, p<0.05; **, p<0.005; ***, p=0.0005; ****, p<0.0001).

