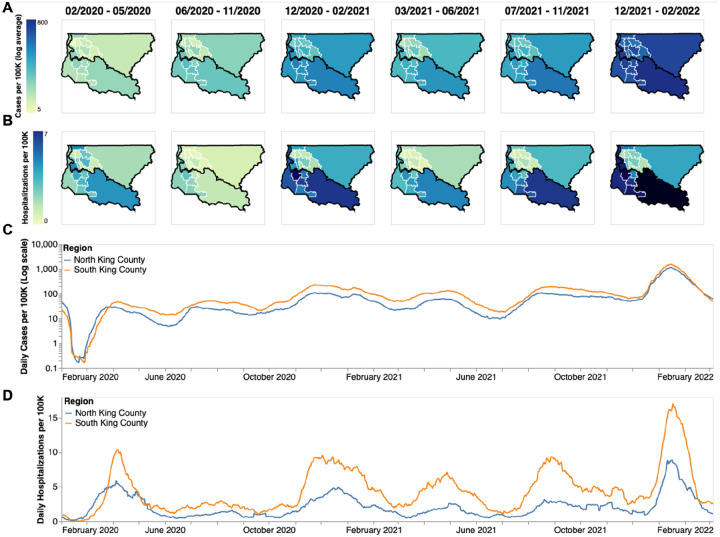
Figure 1: Descriptive Epidemiology of SARS-CoV-2 Epidemic in King County, WA.
(A, B) Confirmed positive cases (A) and hospitalizations (B) per 100,000 individuals of SARS-CoV-2 in King County by Public Use Microdata Area (PUMA) averaged for each of the six waves of the epidemic up until March 2022. Dark borders denote geographical boundaries between North and South King County (C, D) Daily positive cases and hospitalizations of SARS-CoV-2 from February 2020 to March 2022 by region of King County smoothed with a 14 day rolling average. Blue denotes North King County; Orange denotes South King County.

