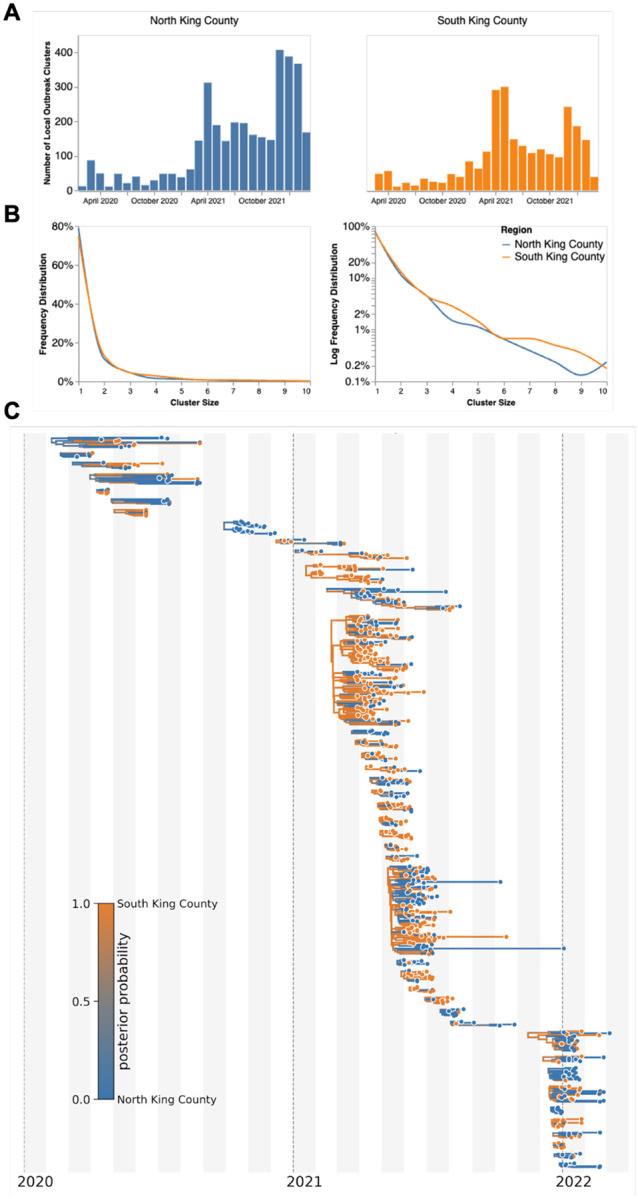
Figure 2: Representative SARS-CoV-2 Clusters by Region in King County.

We combined more than 11,500 SARS-CoV-2 genomes from King County with more than 45,000 contextual sequences from around the world and built a time-resolved phylogeny. King County outbreak clusters were then extracted using a parsimony based clustering approach. We inferred geographic transmission history between each region using MASCOT-GLM. Here, we display the number of clusters over time by King County Region (A), the frequency of cluster size by region on a linear (B left) and log (B right) scale (up to a cluster size of 10. Larger clusters exist but were excluded from the graph for clarity), and the maximum clade credibility tree of all clusters with five or more sequences (C) where color represents posterior probability of being in South King County. The x-axis represents the collection date (for tips), or the inferred time to the most recent common ancestor (for internal nodes). Blue denotes North King County, Orange denotes South King County.
