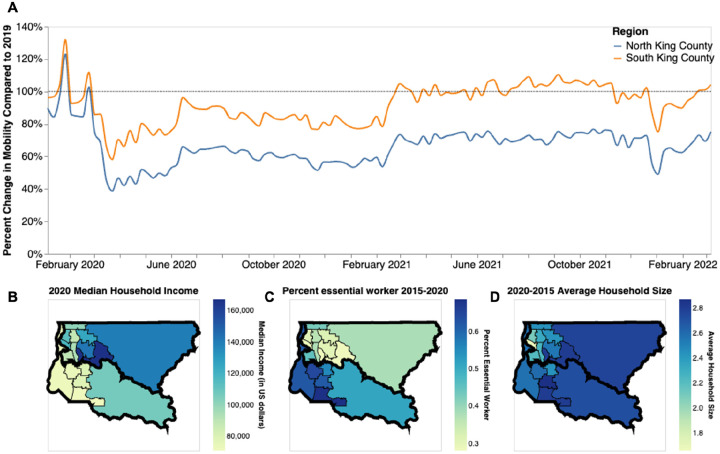
Figure 6: Socioeconomic Characteristics of King County.
A. Percent change in mobility from Feb 2020 to March 2022 over time using average mobility in 2019 as baseline for North (blue line) and South (orange line) King County. Dashed line denotes no change compared to baseline. B,C. Median household income in 2020 (B) Percentage of the active workforce whose occupation is defined as “essential” from 2015–2020 (C) and average household size from 2015–2020 (D) in King County by Public Use Microdata Area (PUMA)

