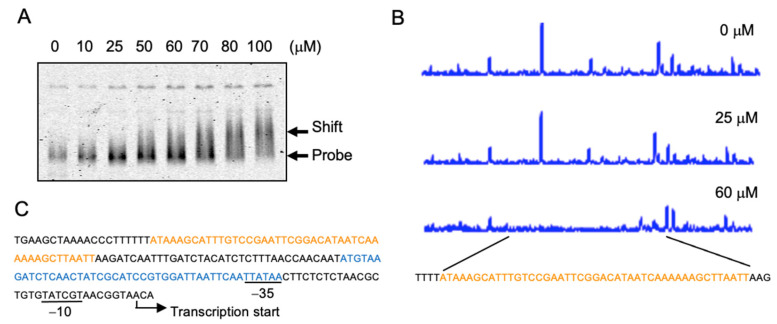
Figure 6.
YgaV binding to the katG promoter: (A) Gel mobility shift analysis of DTT-treated apo-YgaV to the fluorescent-labeled katG promoter DNA. The protein-DNA mixtures were separated by 5% PAGE. After electrophoresis, gels were analyzed using an image analyzer; (B) DNase I footprint analysis of DTT-reduced apo-YgaV with the katG promoter DNA. Regions corresponding to the DNase I protection regions are shown in red. (C) The DNA sequence of the katG promoter region. OxyR and YgaV-binding sites are indicated by blue and red, respectively. The transcription start site and the RNA polymerase recognition sites (−10 and −35) are also shown.

