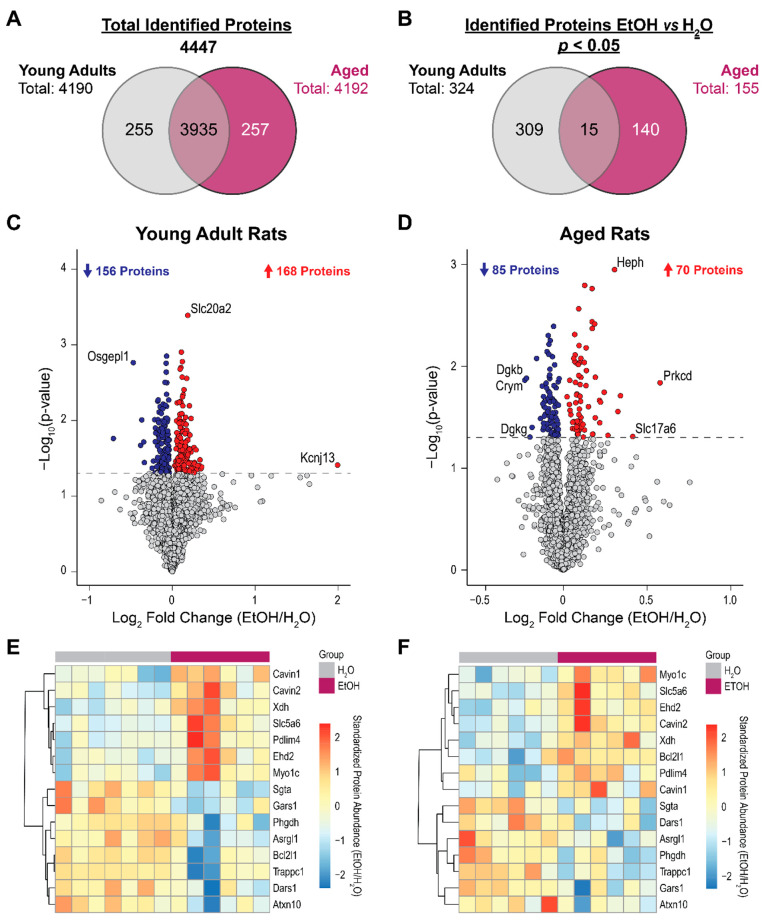
Figure 2.
Overview of the proteomic differences in the hippocampus of ethanol (EtOH)-exposed rats and water (H2O)-exposed controls. (A) Total numbers of proteins identified in each and both age groups. (B) The numbers of identified proteins differed between EtOH and H2O treatment groups at p < 0.05 in each and both age groups. Volcano plots of proteins differed between treatment groups in (C) young adult rats and (D) aged rats. The x-axis represents the Log2 fold change (FC) ratio (EtOH group/water group), while the y-axis represents the −Log10p-value of the between-treatment-group comparison. The gray line indicates the p < 0.05 threshold. Proteins that are upregulated in the EtOH group (Log2FC > 0) are labeled red, while those that are downregulated (Log2FC < 0) are labeled blue. Heatmaps of relative abundance of the 15 proteins that differed at p < 0.05 between treatment groups in both age groups are shown in (E) for young adult rats and in (F) for aged rats.

