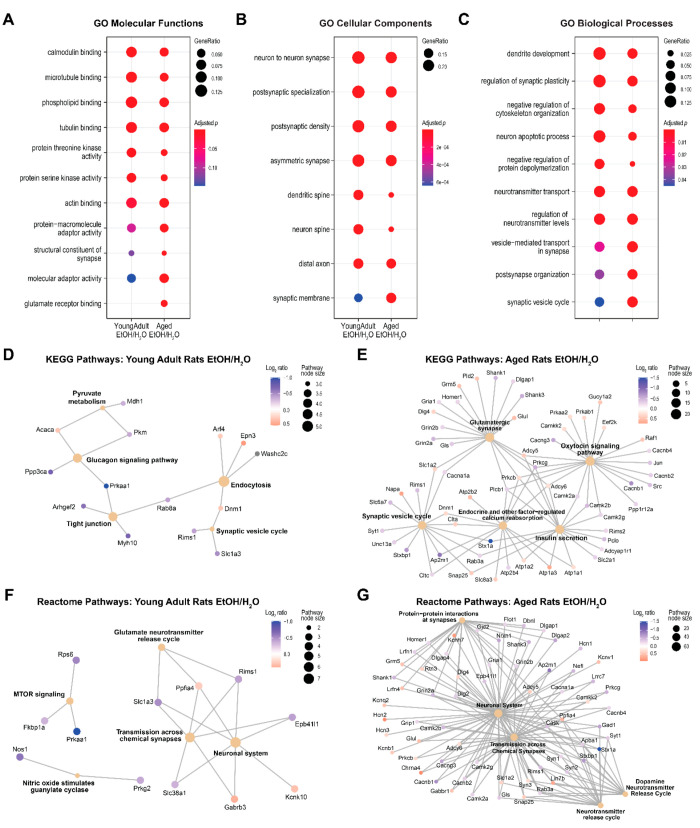
Figure 5.
Pathway enrichment analysis results of the proteins mapped to the phosphosites that differed between ethanol (EtOH)-exposed rats and water (H2O)-exposed controls. (A–C) Results of gene ontology (GO) enrichment analysis. The y-axes list the top enriched pathways in either age group, and columns represent the enrichment results of the young adult and aged rat groups. (D, E) Excerpt results of Kyoto Encyclopedia of Genes and Genomes (KEGG) pathway analyses and (F, G) reactome pathway analysis separated by age groups. Each small node represents a protein; each large node represents a pathway; and a path represents a protein that is mapped to a pathway.

