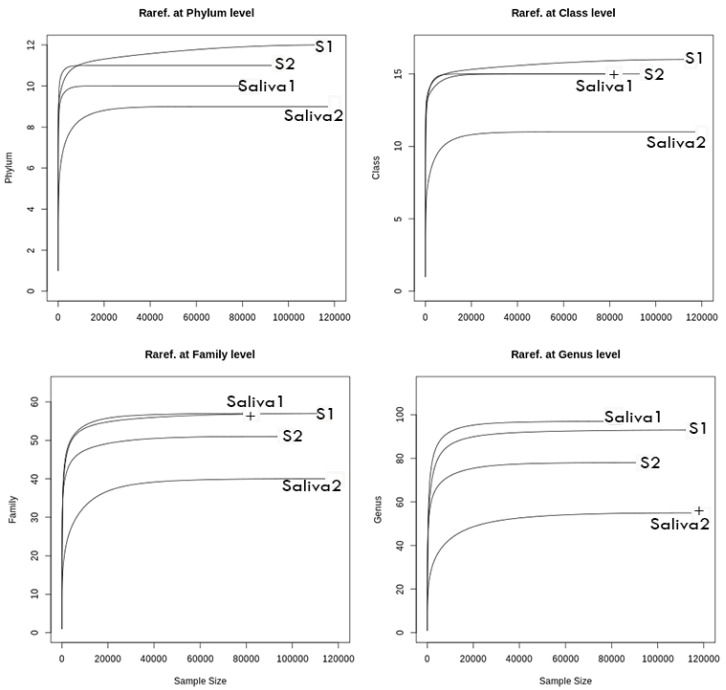
Figure 3.
General rarefaction graphs. Rarefaction analysis permits estimating the overall diversity covered by the obtained squences. The figures represent the number of sequences (x axis) versus the number of taxa (y axis). S1, baseline subgingival sample; S2, post-therapy subgingival sample; Saliva 1, baseline saliva sample; Saliva 2, post-therapy saliva sample.

