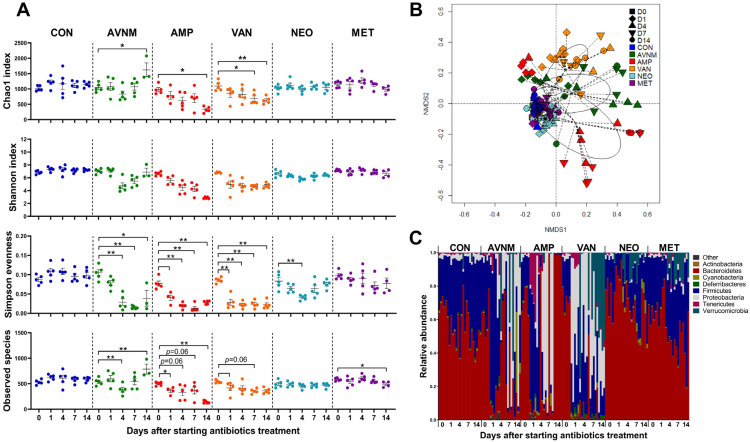
Figure 1.
Effects of antibiotic treatment on fecal microbiota in mice. (A) Changes over time of alpha diversity in each antibiotic group. (B) NMDS plot of the fecal microbiota structure with Bray–Curtis distance. (C) Microbial composition comparison at phylum level. Data are expressed as the mean ± SEM. Asterisks indicate a statistically significant difference (* p < 0.05, ** p < 0.01; Mann–Whitney U test, CON, control; AVNM, mixture of ampicillin, vancomycin, neomycin and metronidazole; AMP, ampicillin; VAN, vancomycin; MET, metronidazole).

