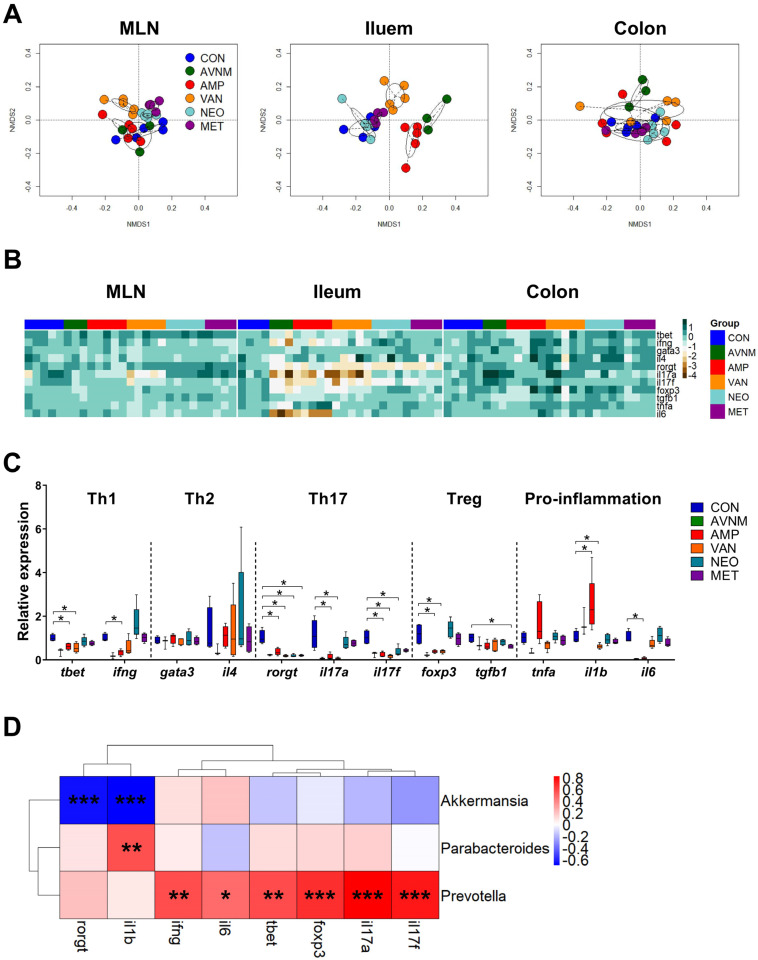
Figure 4.
Effects of antibiotic treatment on immune-related gene expression in the gut and correlation with the gut microbiota. (A) NMDS plots of the fold expression of gene expression in MLN, ileum and colon with Bray–Curtis distance. (B) Heatmap of -log of the fold expression in MLN, ileum and colon. (C) The relative expression of genes related to Th1, Th2, Th17, Treg, and pro-inflammation in ileum. (D) The Spearman’s correlation analysis between relative abundance of major discriminative taxa and the relative expression of genes significantly changed to CON in AMP and VAN groups. Data are expressed as the mean ± SEM. Asterisks indicate a statistically significant difference (* p < 0.05, ** p < 0.01, *** p < 0.001; Mann–Whitney U test and Spearman’s correlation, CON, control; AVNM, mixture of ampicillin, vancomycin, neomycin and metronidazole; AMP, ampicillin; VAN, vancomycin; MET, metronidazole).

