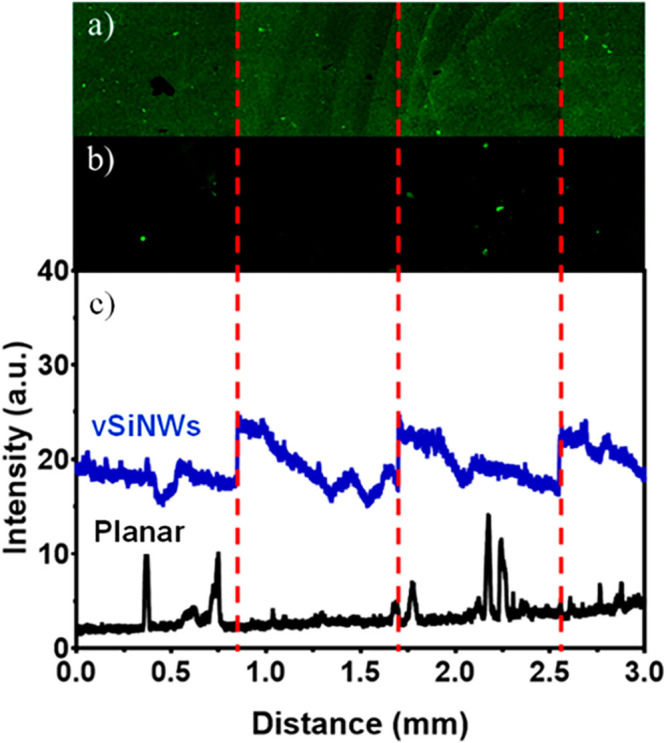
Figure 3.

Fluorescence images of (a) a vSiNW surface postfunctionalization and (b) a planar surface postfunctionalization. (c) Visual comparison of the intensities, demonstrating the increased number of receptors present on the Si NW surface. Both the planar and Si NW samples were functionalized with ER-α and stained by fluorescent-tagged antibodies. Each sample was imaged over a 3 mm long by 0.85 mm high area to ensure that the increase in intensity was consistent across a large distance. The red dashed line shows the edges of the tiles that were joined.
