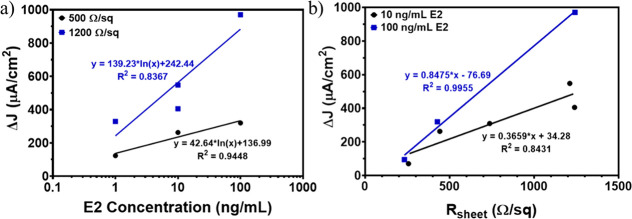
Figure 4.
(a) Relationship between current density (ΔJ) and E2 concentration for biosensors at 500 Ω/sq (black dots) and 1200 Ω/sq (blue squares) showing that ΔJ increases at different rates for the two different Rsheet values. The semilogarithmic regression fits and equations at 500 Ω/sq (black solid line) and 1200 Ω/sq (blue solid line) are also shown. (b) The relationship between ΔJ and Rsheet for biosensors exposed to 10 ng/mL E2 (black dots) and 100 ng/mL E2 (blue squares) indicates that, for higher Rsheet values, ΔJ is higher for the same E2 concentration. The linear regression fits and equations of 10 ng/mL E2 (black solid line) and 100 ng/mL E2 (blue solid line) are also shown.

