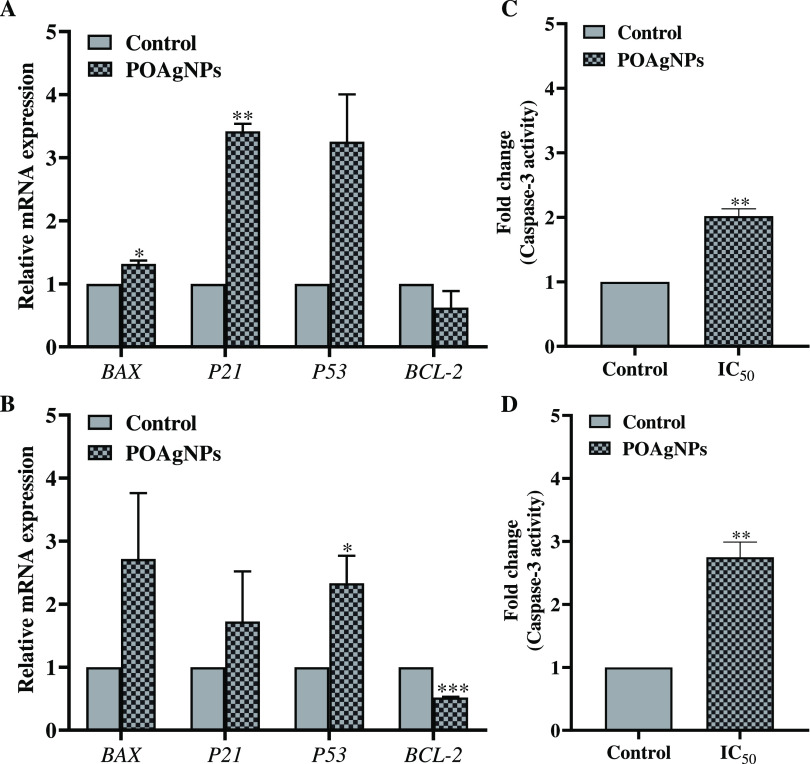
Figure 8.
Representation of differential gene expressions and enhanced Caspase-3 activation induced after treatment of breast cancer cells with POAgNPs. Upregulation of the apoptotic genes BAX, P21, and P53 and downregulation of the anti-apoptotic gene BCL-2 after treatment with the IC50 concentration of POAgNPs (A). MDA-MB-231 cancer cell line (B). MCF-7 cancer cell line. Fold change in Caspase-3 activity after treatment of breast cancer cells with the IC50 concentration of POAgNPs (C). MDA-MB-231 cancer cell line (D). MCF-7 cancer cell line. All the experiments were performed in triplicate. The p-value was calculated by comparing means ± SD of relative mRNA expression using the unpaired Student t-test (*p < 0.05, **p < 0.01, ***p < 0.001) and fold change in caspase-3 activity, using one-way ANOVA followed by Tukey to determine statistical significance values, which are as follows: ***p ≤ 0.001; **p ≤ 0.002; and *p ≤ 0.033.

