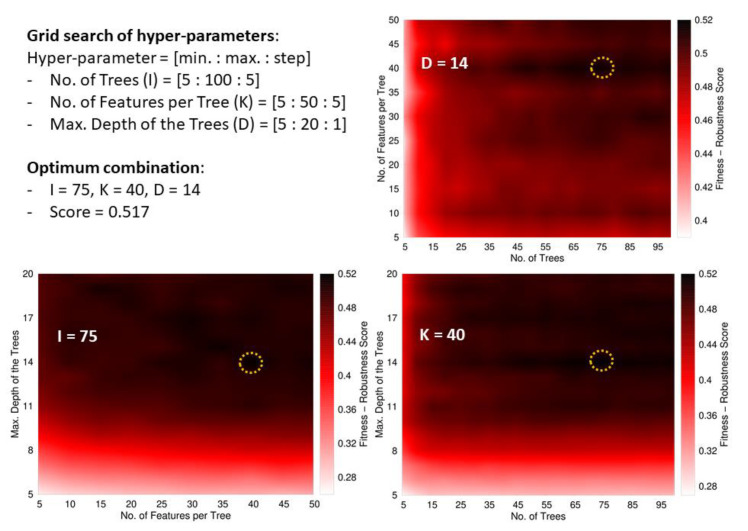
Figure 2.
Tuning scheme of the RF’s hyperparameters. The top-left panel summarizes the boundaries and binning of the grid search with the three hyper-parameters. This panel also shows the optimum value found for the FRS function and the values of the hyper-parameters in the corresponding solution. The remaining panels show surfaces plotted as heat maps keeping one of the hyper-parameters fixed at its optimum value. The dark regions indicate the best solutions. The optimum regions are highlighted with a dashed circle. The plots highlight that the most critical parameter is the depth of the trees, while high-scored models can be obtained with almost any value of the other hyper-parameters; solutions with a depth below 10 are poorly scored.

