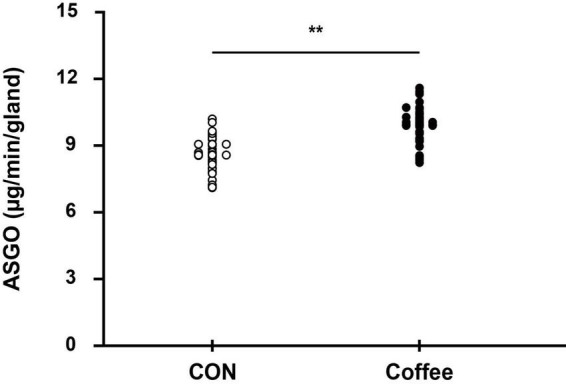
FIGURE 5.

Comparison of sweating between CON and Coffee subjects showing an active sweat output per gland. Statistical significance difference, **p < 0.01. CON, no coffee group (n = 40); Coffee, coffee intake group (n = 40); ASGO, activated sweat gland output.
