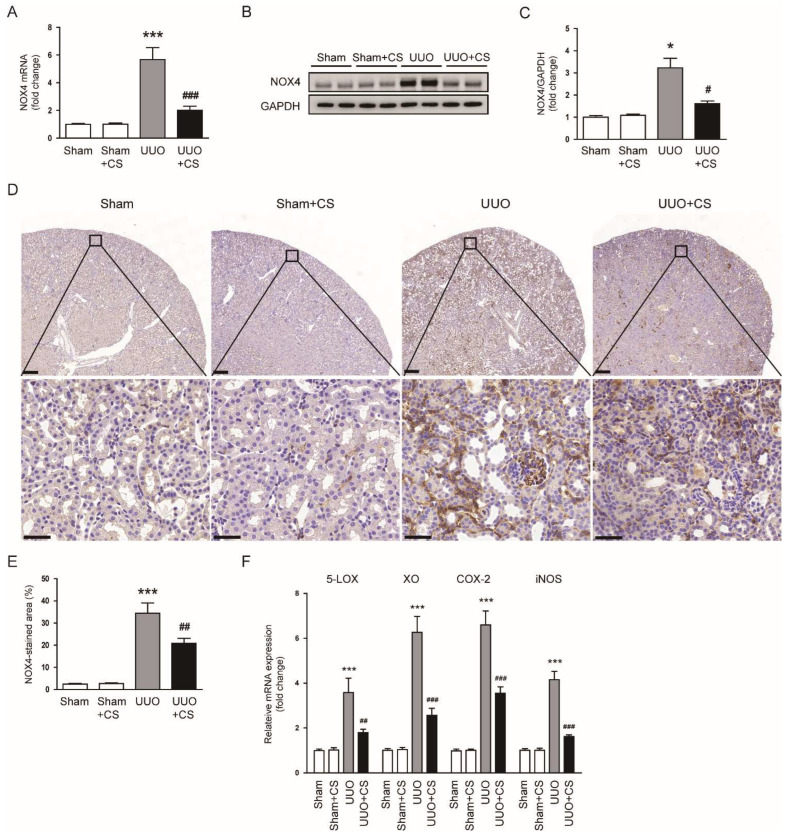
Figure 6.
Effects of CS on pro-oxidant enzymes in UUO mice. (A) Renal NOX4 mRNA levels. (B) Western blotting of NOX4. (C) Quantification of Western blots for NOX4. (D) IHC staining of kidney sections for NOX4. Scale bars in the upper panel = 200 μm. Scale bars in the lower panel = 40 μm. (E) Percentages of NOX4-stained area. (F) Renal 5-LOX, XO, COX-2 and iNOS mRNA levels. * p < 0.05 and *** p < 0.001 vs. Sham. # p < 0.05, ## p < 0.01 and ### p < 0.001 vs. UUO.

