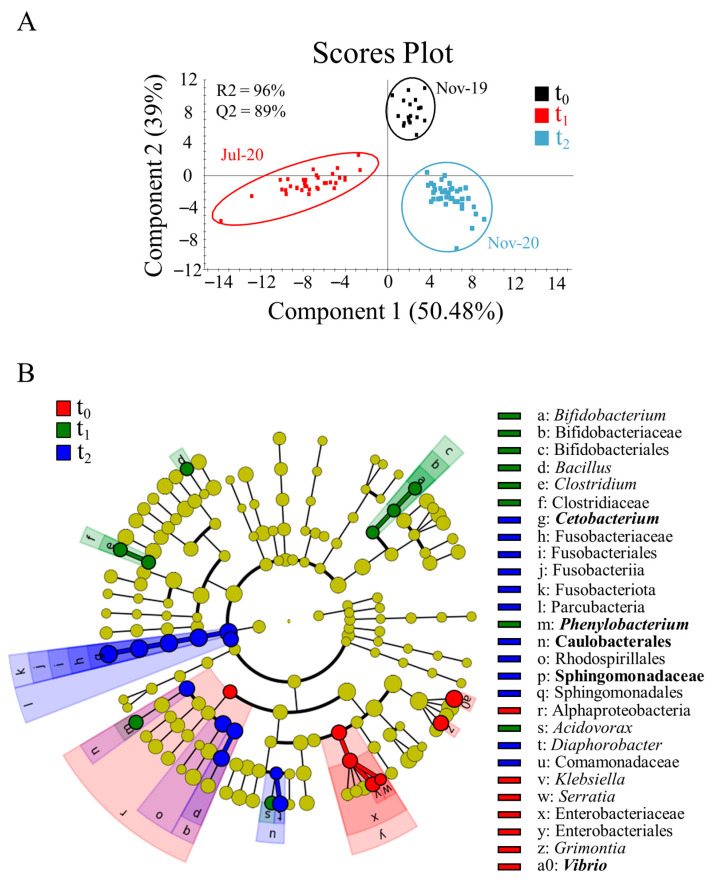
Figure 2.
(A) Two-dimensional partial least-square discriminant analysis (PLS-DA) scores plot showing the differentiation of gut microbiota of gilthead sea bream over the production cycle regardless of diet. The validation permutational test can be found in Supplementary Figure S3A. (B) Cladogram for the linear discriminant analysis effect size (LEfSe) with the OTUs (VIP ≥ 1) that most likely drive differences in t0 (red), t1 (green), and t2 (blue). Results show the OTU classification at the level of phylum, class, order, family, genus and species from the inside to the outside. Taxon in bold indicates taxa belonging to the core microbiota.

