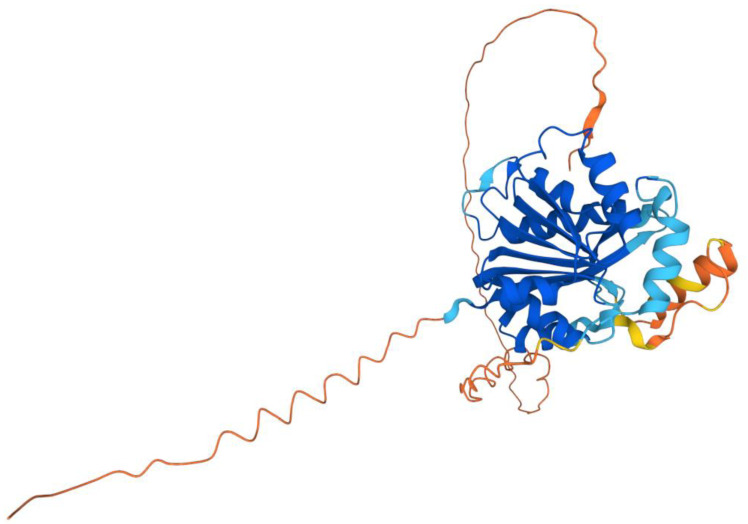
Figure 4.
AlphaFold model of human COQ3. Model color corresponds to model confidence in each region. Very high confidence in dark blue (pLDDT > 90); confident in light blue (90 > pLDDT > 70); low confidence in yellow (70 > pLDDT > 50); very low confidence in orange (pLDDT < 50). pLDDT is a measure of per-residue confidence. pLDDT < 50 is a reasonably strong predictor of disorder for the corresponding residue. Figure was generated by the AlphaFold Protein Structure Database; adapted with permission from [39,54].

