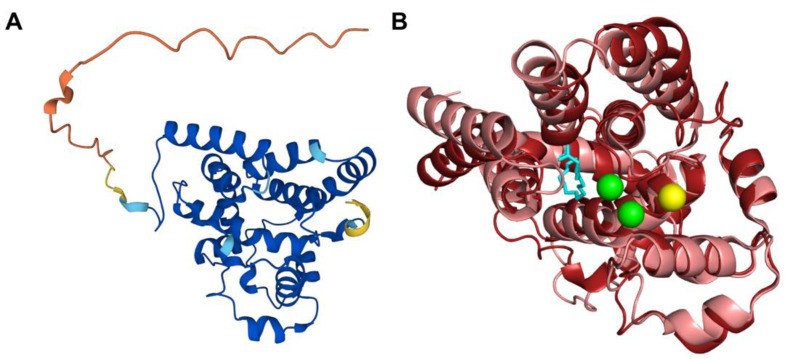
Figure 10.
Comparison of the COQ4 AlphaFold model and the structure of Alr8543. (A) AlphaFold model of single chain of COQ4. Model color corresponds to model confidence as described in Figure 4. Figure was generated by the AlphaFold Protein Structure Database; adapted with permission from [39,54]. (B) Structural alignment of the human COQ4 AlphaFold model (shown in dark red) and Chain B of the crystal structure of Alr8543 protein (shown in salmon, PDB: 6E12) in complex with oleic acid (shown in cyan), Mg2+ (shown in green), and Cl− (shown in yellow). Residues 1–44 of the AlphaFold model were omitted due to disordered structure.

