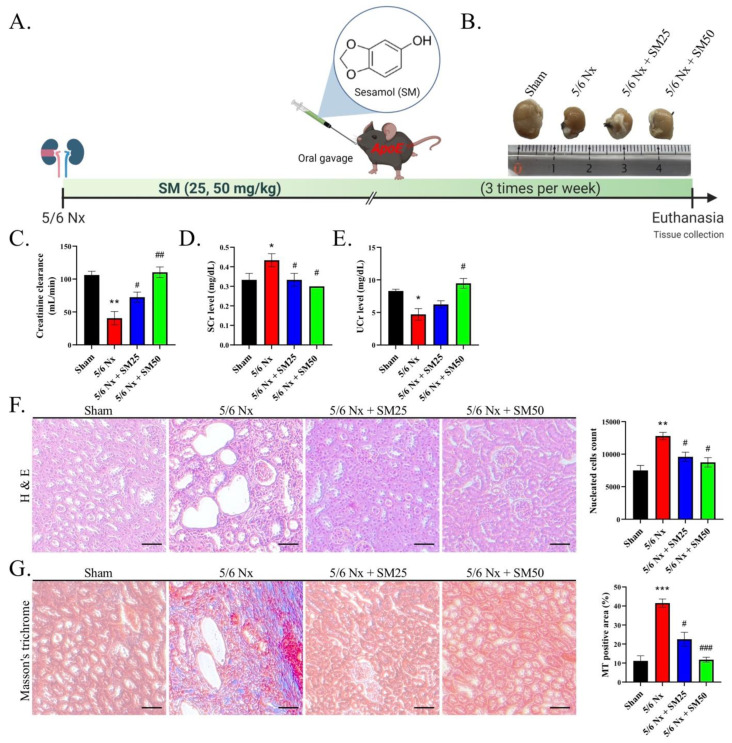
Figure 1.
Evaluation of renal function and histopathology after eight weeks of 5/6 Nx. (A) Schematic representation of the 5/6 nephrectomy model of the ApoE−/− mice (n = 6 per group). (B) Representative images of the kidneys from each group. (C) Creatinine clearance, (D) serum creatinine (Scr), and (E) urine creatinine (Ucr). Creatinine clearance was evaluated by collecting urine after 24 h. The urine and serum creatinine levels in the mice were measured after different treatments. (F) Observation and calculation of changes in the glomerular tuft architecture, glomerular microvascular lipid accumulation, and infiltration of immune cells (nucleated cells) in the kidneys (H&E staining) (200×); scale bar = 100 μm. (G) Images of kidney tissues with Masson’s trichrome staining. Masson’s trichrome-stained positive area; scale bar = 100 μm. Data are expressed as the mean ± SEM (n = 6). * p < 0.05, ** p < 0.01, *** p < 0.001 vs. sham group. # p < 0.05, ## p < 0.01, ### p < 0.001 vs. 5/6 Nx group.

