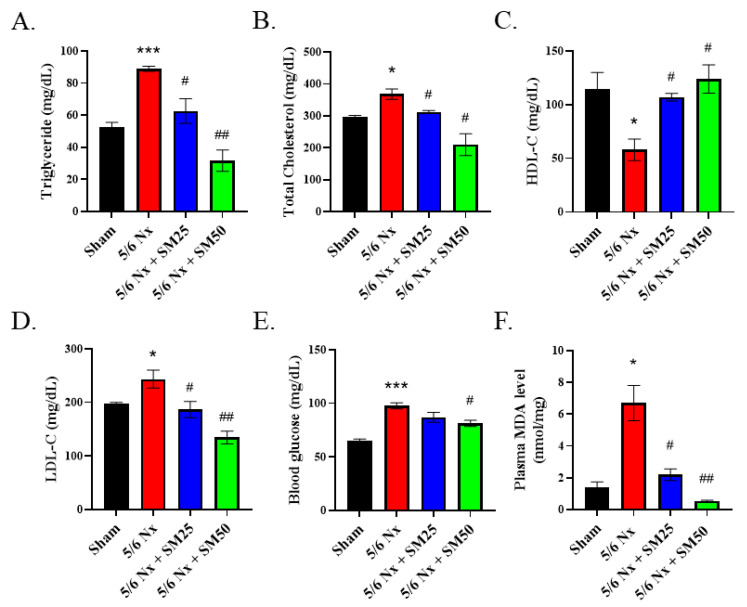
Figure 3.
Biochemical analyses of the plasma of female ApoE–/– mice subjected to different treatments. Levels of (A) triglycerides, (B) total cholesterol, (C) HDL-cholesterol, (D) LDL-cholesterol, (E) blood glucose, and (F) plasma MDA. Data are expressed as the mean ± SEM (n = 6). * p < 0.05, *** p < 0.001 vs. sham group. # p < 0.05, ## p < 0.01 vs. 5/6 Nx group.

