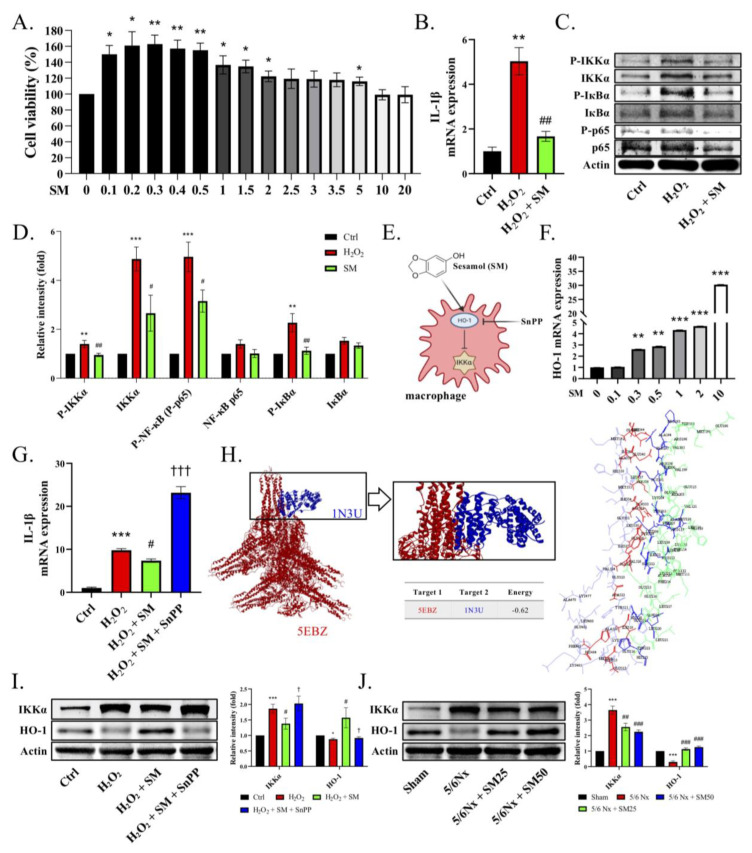
Figure 5.
SM inhibits the IKKα signaling pathway via the upregulation of HO-1 in THP-1 cells. The THP-1 cells were differentiated using 25 ng/mL PMA for two days and fresh medium for one day. (A) Viability of SM-treated THP-1 cells measured by WST-1 assay. (B–D) The THP-1 cells were pretreated with SM or DMSO for 1 h and then stimulated with H2O2 (5 μM) for 24 h. The cells were harvested for qRT-PCR or immunoblotting. (B) Transcriptional levels of IL-1β or (C,D) immunoblotting of p-IKKα, IKKα, p-p65, and p-IкBα. (E) Expected interactions of SM, heme oxygenase-1 (HO-1), and IKKα. (F) Transcriptional levels of HO-1 after treatment with SM. (G) Transcriptional levels of IL-1β. (H) Visualization of the molecular docking pose for the interaction between IKKα and HO-1. Protein–protein interaction between IKKα (PDB code: 5EBZ; red structure) and HO-1 (PDB code: 1N3U; blue structure) in 3D. Protein–protein interaction residue. (I) Immunoblotting of IKKα and HO-1 after the administration of H2O2, SM, and SnPP to the THP-1 cells. (J) Immunoblotting of IKKα and HO-1 in the kidneys of mice. Data are expressed as the mean ± SEM (n = 4). * p < 0.05, ** p < 0.01, *** p < 0.001 vs. control, 0 μM group, or sham group. # p < 0.05, ## p < 0.01, ### p < 0.001 vs. H2O2 group or 5/6Nx group. † p < 0.05, ††† p < 0.001 vs. H2O2 + SM group.

