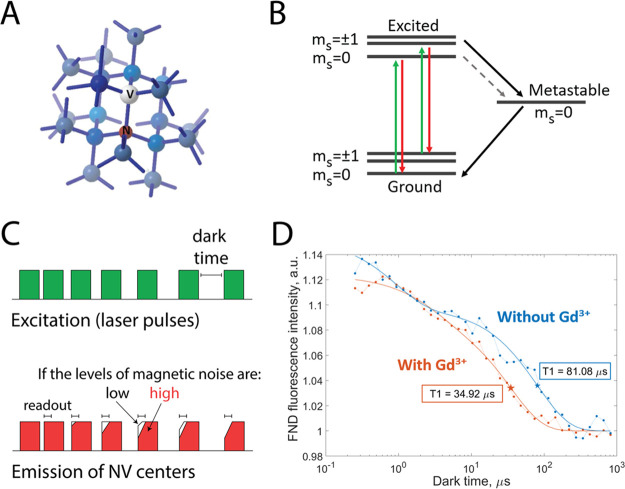
Figure 1.
Foundation of NV center based relaxometry. (A) Nitrogen vacancy centers are defects of the diamond crystal structure: a nitrogen atom is present instead of one of the carbon atoms, and one of the neighboring positions in the lattice is vacant. (B) A diagram of the NV center’s energy levels. (C) The NV centers are pumped into a brighter ground state with a green laser pulse. The laser is switched off for a predefined period of time (dark time), and the NV centers are allowed to relax back to the darker equilibrium state. The observed fluorescence becomes less bright as the dark times increase. The transition from the bright polarized state to the darker equilibrium state happens faster at higher levels of magnetic noise (e.g., due to paramagnetic species). (D) The NV center’s fluorescence intensity plotted against the corresponding dark times can be used to calculate the T1 relaxation constant. If the relaxation is slower, one observes longer T1 values (blue; diamond without Gd3+). Faster relaxation can happen due to the changes in the NV center’s environment, such as the presence of paramagnetic species. In this case, the T1 curves are shifted to the left, producing shorter T1 values (orange; after adding paramagnetic Gd3+ ions).

