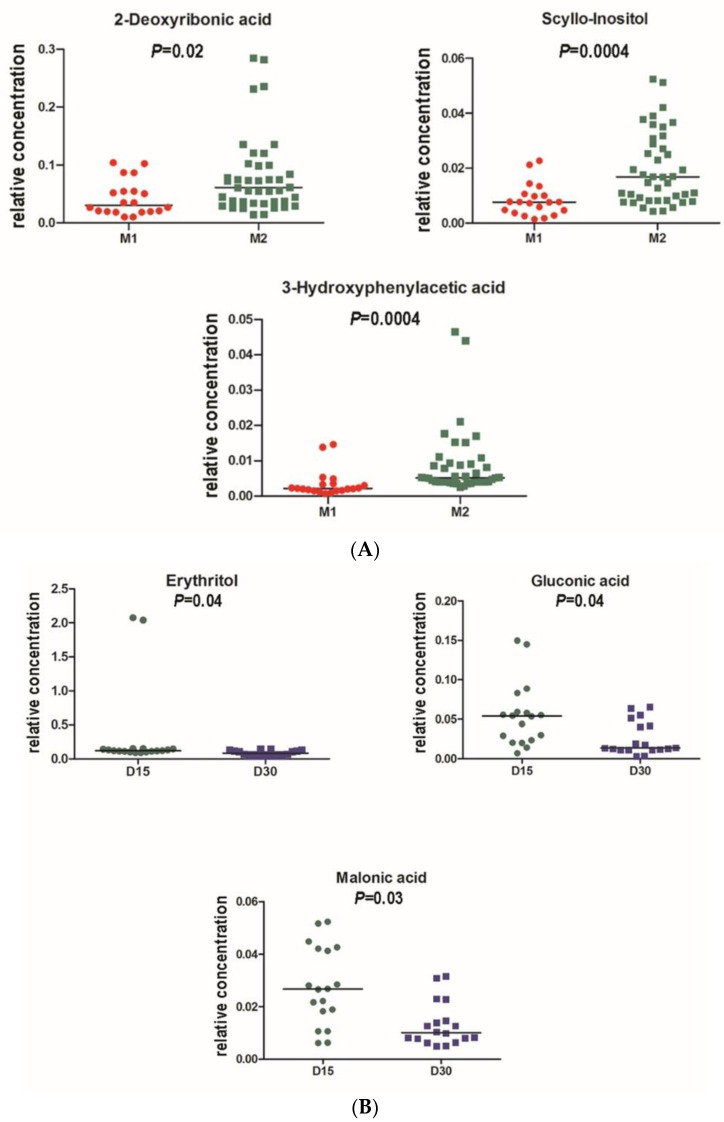
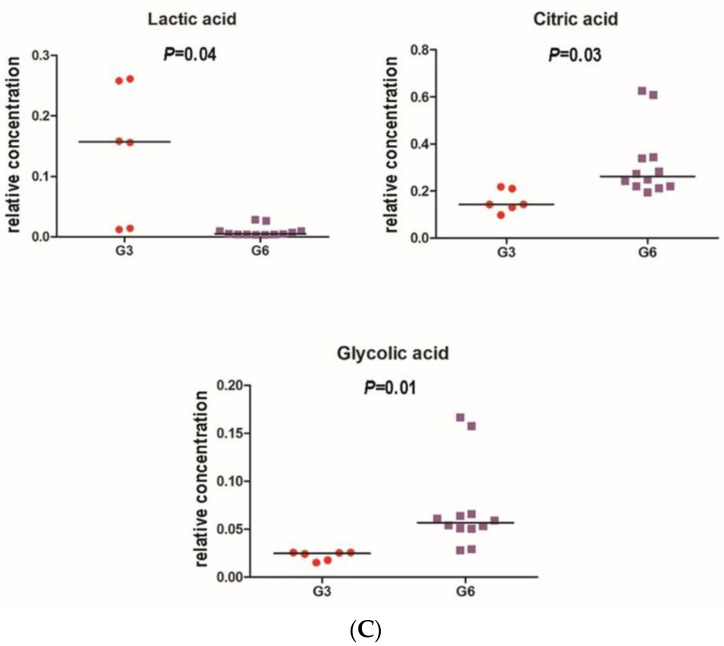
Figure 5.
(A), Univariate analysis (Mann–Whitney) for a grape diet (Day 30) compared to restricted diet (Day 15) for UV-resistant subjects (M1; n = 9; red) and non-resistant (M2; n = 20; green) subjects. Data presented as duplicate analyses; p-values are Bonferroni corrected for four comparisons. All three urinary metabolites shown were depressed in the UV-resistant group. (B), Univariate analysis (Mann–Whitney) for urinary metabolites after grape diet (Day 30; blue) compared to restricted diet (Day 15; green) for UV-resistant subjects (n = 9). Data presented as duplicate analyses; p-values are Bonferroni corrected for 14 comparisons and remain barely statistically significant. All three urinary metabolites shown were depressed by grape diet. (C), Univariate analysis (Mann–Whitney) for urinary metabolites after the final washout period (Day 60) showing separation of subgroup G3 (n = 3; red) vs. subgroup G6 (n = 6; purple). G3 showed UV resistance on Day 30 and Day 60; G6 showed UV resistance on Day 30 but not Day 60. Data presented as duplicate analyses; p-values are Bonferroni corrected for 4 comparisons.


