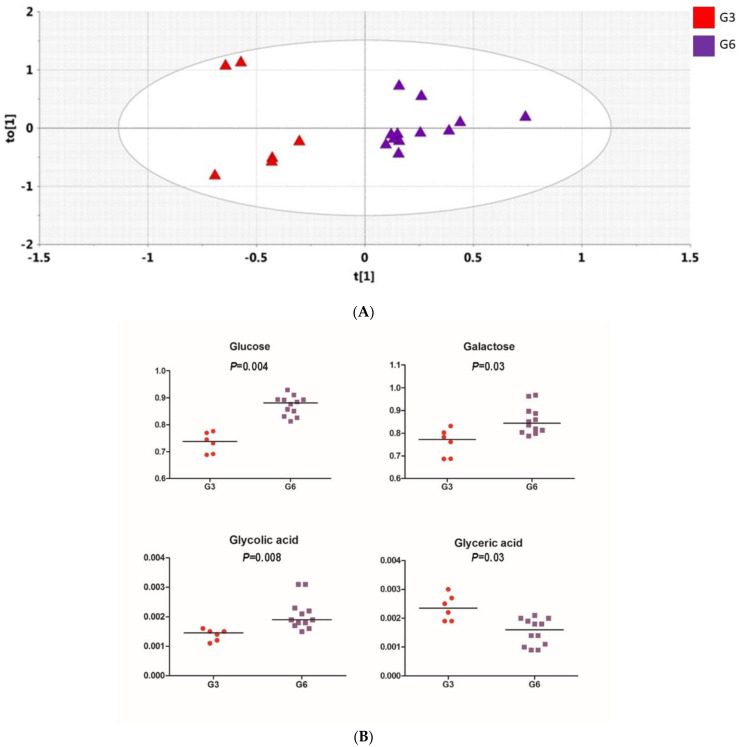
Figure 6.
(A) OPLS-DA scores plot for plasma showing separation of subgroup G3 (n = 3; red) vs. subgroup G6 (n = 6; purple). G3 showed UV resistance on Day 30 and Day 60; G6 showed UV resistance on Day 30, but not Day 60. The difference is still apparent after the final washout period (Day 60). Data presented as duplicate analyses. (B) Univariate analysis (Mann–Whitney) for plasma metabolites after the final washout period (Day 60) showing separation of subgroup G3 (n = 3; red) vs. subgroup G6 (n = 6; purple). Data presented as duplicate analyses; p-values are Bonferroni corrected.

