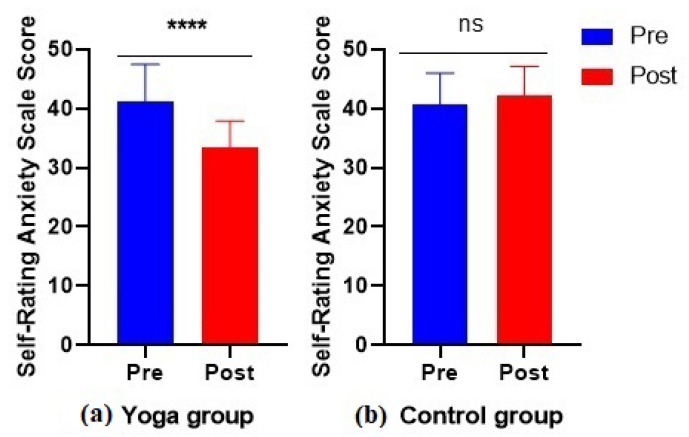
Figure 4.
Results from the SAS questionnaire for two different groups (a) experimental group and (b) control group, where **** and ns represents significiant and non-significant respectively. Both groups were further divided into pre and post experimental and control group, respectively. Red and blue color represent pre and post experimental and control groups, respectively.

