Figure 5.
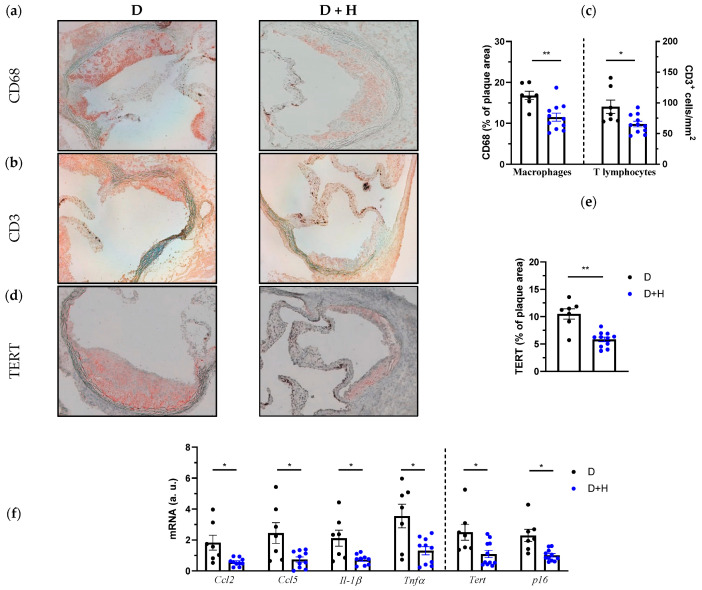
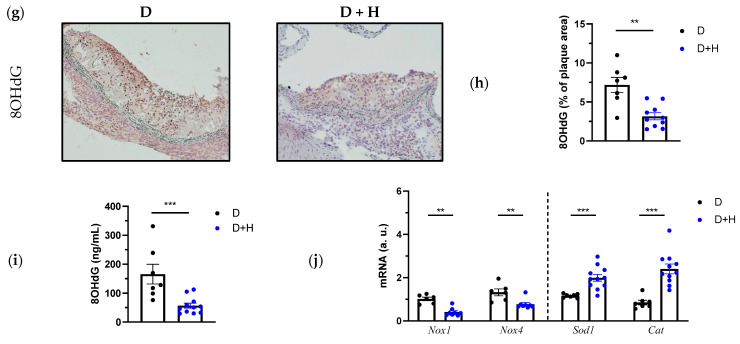
Attenuated inflammation, senescence and oxidative stress in aortic lesions of hidrosmin-treated mice. Representative images (magnification ×200) for CD68+ macrophages (a) and CD3+ T cells immunostaining (b) in aortic lesions from diabetic ApoE KO mice (untreated, D; hidrosmin treatment, D + H) and quantification (c). (d) Representative images (magnification ×200) of TERT immunostaining and quantification (e). (f) Real-time PCR analysis of inflammatory (Ccl2, Ccl5, Il-1β and Tnfα) and senescence (Tert and p16) genes in mouse aorta. Values normalized to 18S rRNA are expressed as arbitrary units (a.u.). (g) Representative images (magnification ×200) of 8OHdG immunoperoxidase in mouse aorta and quantification of positive staining (h). (i) Quantification of 8OHdG levels in serum samples by ELISA method. (j) Gene expression analysis of pro-oxidant (Nox1 and Nox4) and antioxidant (Sod1 and Catalase, Cat) genes in mouse aorta. Values normalized to 18S rRNA are expressed as arbitrary units (a.u.). Graphs represent individual values and mean ± SEM of each group (D, n = 6–7; D + H, n = 8–11). * p < 0.05, ** p < 0.01 and *** p < 0.001 vs. D group by Mann–Whitney U test.


