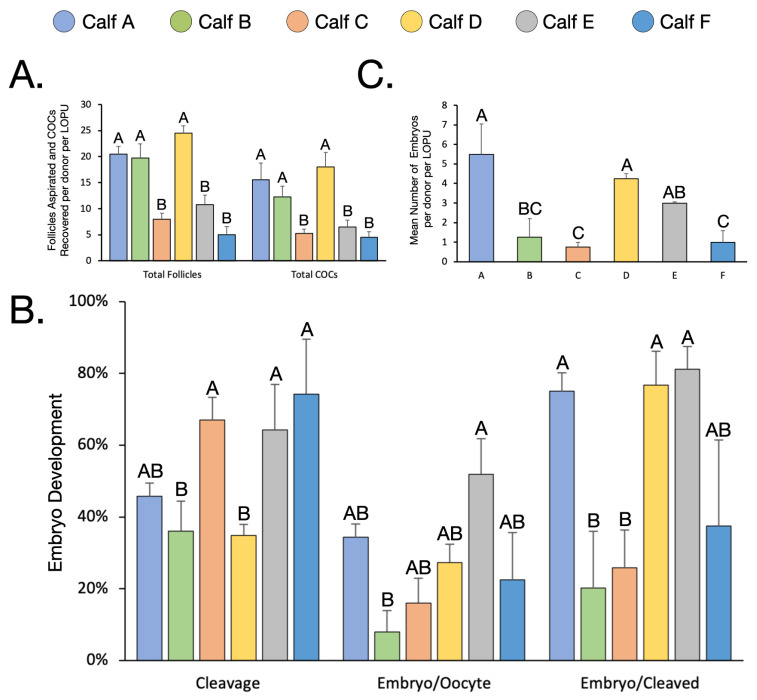
Figure 3.
The effect of individual variation. (A). The mean number of follicles aspirated and COCs recovered per animal. (B). The embryo development rates per animal. (C). The mean number of embryos produced per animals per LOPU. Values within the same chart with different script (A–C) differ significantly (p < 0.05).

