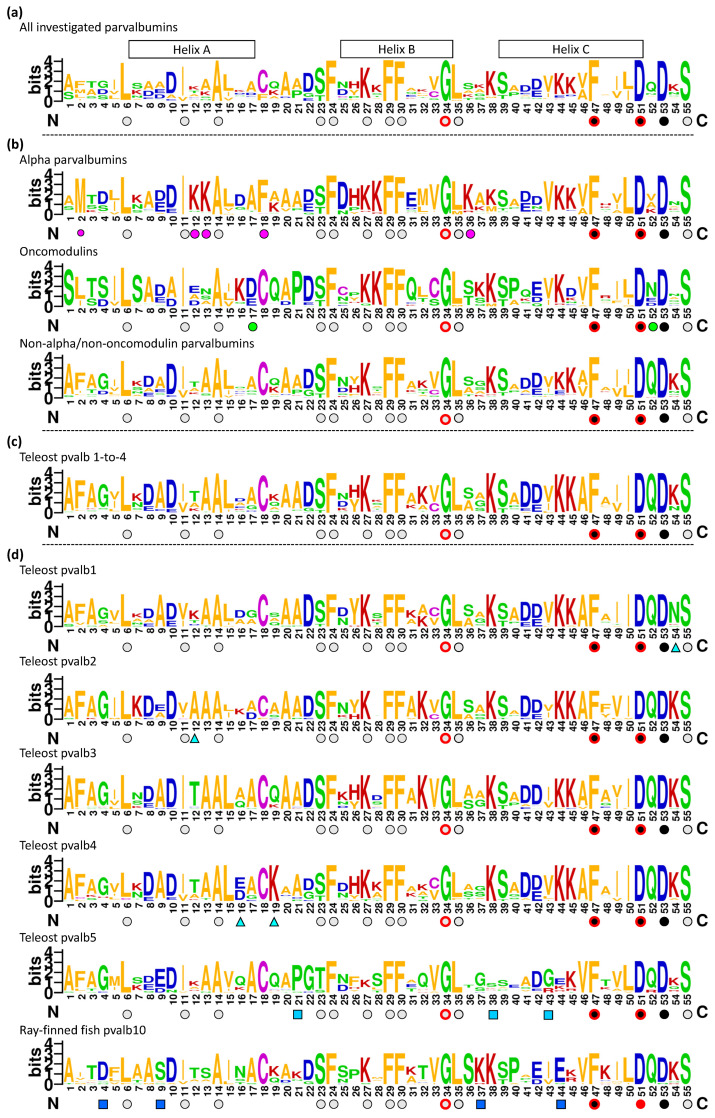
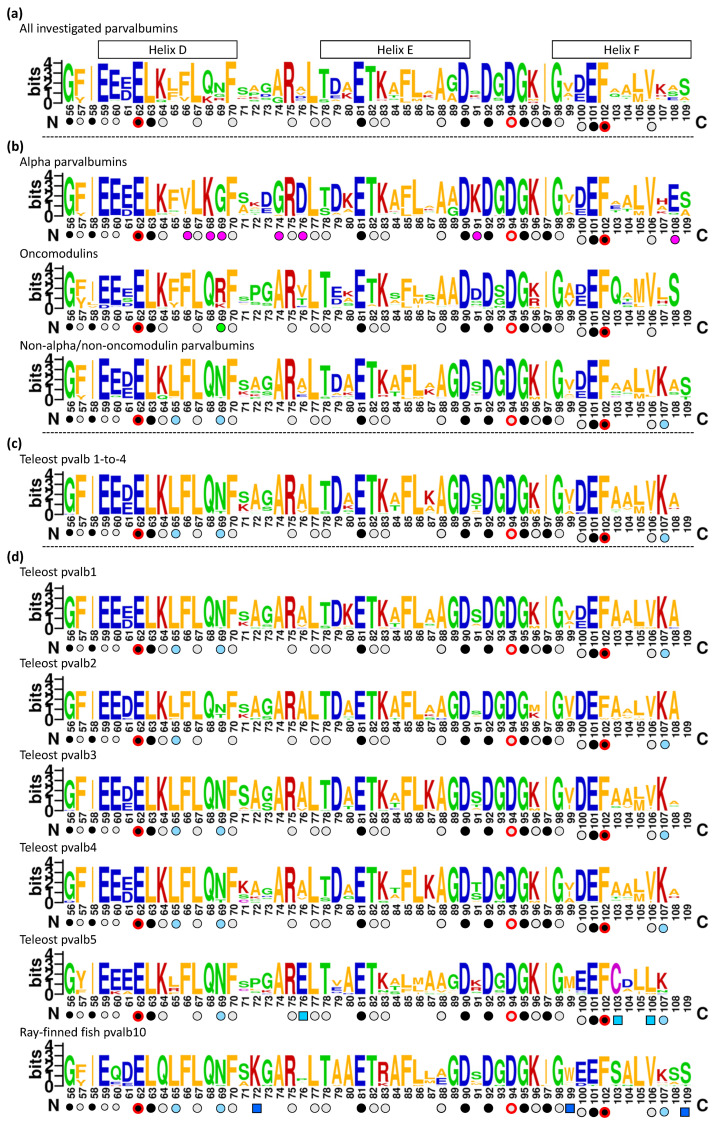
Figure 3.
Parvalbumin consensus sequences. This is a two-page figure with residues 1–55 shown on the first page and residues 56–109 on the second. Sequence logos are shown for the parvalbumin sequences as compared in the Supplementary File S3 alignment figure (a) for all sequences, (b) per α-parvalbumin, oncomodulin, and non-α/non-oncomodulin categories, (c) for the combined teleost pvalb1-to-4 sequences, and (d) for parvalbumins encoded by individual teleost genes pvalb1, -2, 3, 4, 5, and -10. The sizes of the single letters that represent amino acids correspond with their level of conservation. The symbols below the sequences highlight, somewhat arbitrarily, notable high levels of conservation of residues or similar residues: Black circles, EF-hand domain molecules (following [80]); gray circles, (more specifically) parvalbumins; magenta circles, α-parvalbumins; green circles, oncomodulins; blue circles, non-α/non-oncomodulin parvalbumins; cyan triangles, rather characteristic of teleost pvalb1, -2, or -4; light-blue squares, teleost pvalb5; dark-blue squares, teleost pvalb10. Red lines around black or gray circles indicate that the residue is conserved in all the 210 investigated parvalbumin sequences (Supplementary File S3).


