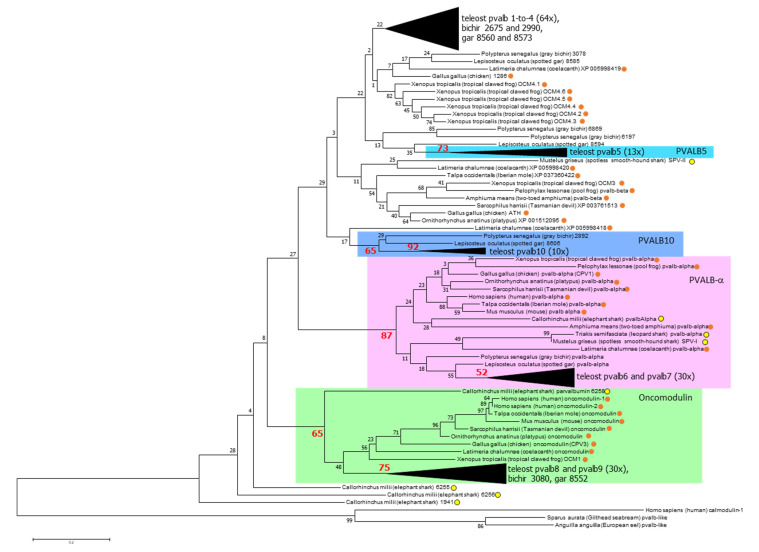
Figure 4.
Molecular Phylogenetic analysis by Maximum Likelihood method. The percentage of trees in which the associated taxa clustered together is shown next to the branches, and important values >50 are highlighted in large red font. The tree is drawn to scale, with branch lengths measured in the number of substitutions per site. Clusters with teleost sequences (including sometimes also non-teleost sequences) are condensed; for a non-condensed tree and full descriptions see Supplementary File S4A. This type of analysis can not clearly distinguish between teleost pvalb1, -2, -3, and -4, between teleost pvalb6 and -7; and between teleost pvalb8 and -9 (Supplementary File S4; see also [26]). Yellow and orange circles highlight parvalbumin sequences of sharks/rays/chimeras and lobe-finned-fish/tetrapods, respectively.

