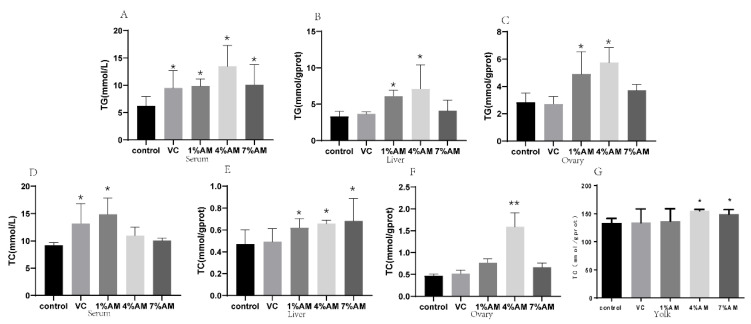
Figure 5.
Effects of feed supplemented with AM on TG and TC. TG content in serum (A), liver (B) and ovary (C), TC content in serum (D), liver (E), ovary (F) and yolk (G). Values are shown as mean ± SD (n = 6). Significant differences compared to control group are designated as ** show very significant difference at p < 0.01, * show significant difference at p < 0.05. Abbreviations: TG, Triglyceride, TC, Cholesterol.

