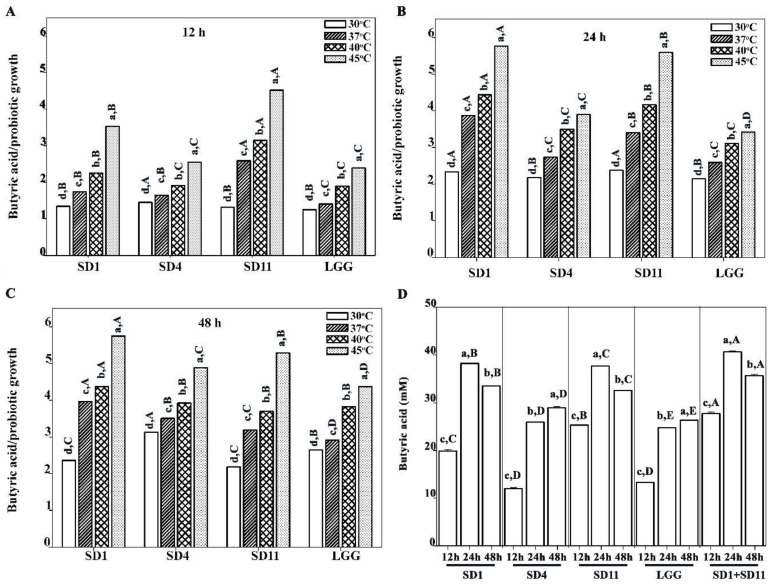
Figure 3.
Ratio of butyric acid production and bacterial growth rate at different incubation times: (A) 12 h, (B) 24 h, and (C) 48 h; (D) butyric acid production (mM) by probiotics cultured at 45 °C at various incubation times of 12, 24, and 48 h. Lowercase letters show significant differences between different incubation temperatures (A–C) or significant differences between different incubation times (D) at each probiotic strain (p < 0.05). Uppercase letters show significant differences between different probiotic strains (A–C) at each incubation temperature or show significant differences between different probiotic strains at each incubation time (D) (p < 0.05). Statistical analysis was performed with the Kruskal–Wallis test, followed by the Mann–Whitney U test.

