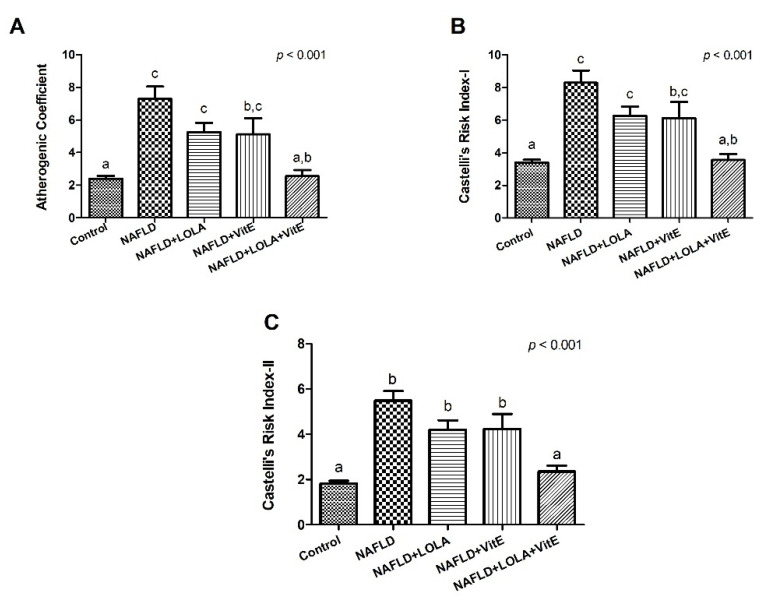
Figure 2.
Atherogenic ratios. (A) Atherogenic coefficient (AC), (B) Castelli’s Risk Index (CRI)-I, and (C) CRI-II. Data expressed as mean ± standard deviation, Tukey’s test. Different letters indicate a significant difference between groups (p < 0.05). LOLA: ornithine aspartate; NAFLD: nonalcoholic fatty liver disease, and VitE: vitamin E.

